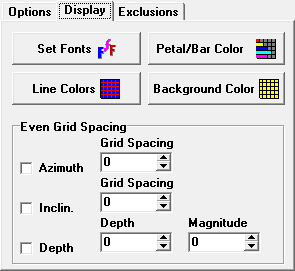
Fonts and Colors. You have complete control over the background color, the line color, the petals and bars and fonts of all the graphs. To change the fonts and colors, press the appropriate button and make the desired changes. Note. The petal color will not change until you reprocess the data. Also, if you are using large fonts or the numbers are large, parts of the lettering may be clipped off. You can correct this problem resizing the window, which will resize the graphs.
Grid Line Spacing. The graphs normally have four grid lines marking the petal lengths. This is because it is hard to fit more than four lines on the graph. However, because of the fact that the grid lines are evenly spaced across the range of values you can have odd grid values like: 0, 129, 258, and 387.
Even Spacing. To solve this problem, the Viewer allows you to set the grid lines to even values. You do this by enabling Azimuth, Inclination or Depth options in the “Even Grid Spacing” box. When you do this, the grid spacing will be based on the Spacing values you set to the right. For example, if spacing value is set to 100, the grids lines will occur at 100, 200, 300, etc. The changes only take effect after you reprocess the data. |
|