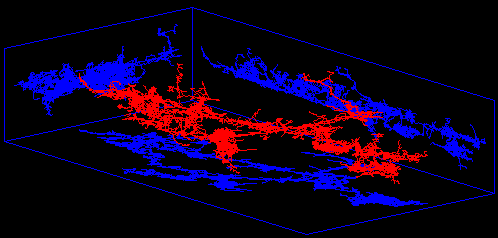
A Shadow Box is a way of plotting a cave that helps you see the three-dimensional aspects of cave. The Shadow Box option creates an open box around the cave and mirrors the cave on the walls of the box. This makes the cave appear more three-dimensional. The Shadow Box also allows you to put Grids on the walls that mark the dimensions of the cave. You can also display the Grids alone, creating a "map" grid under, over or around the cave.
Go to the Compass web site for more examples of the Shadow Boxes.
Displaying Shadow Boxes and Grids. You can display a Shadow Box around a cave by selecting the "Display->Show->Display Shadow Box" option from the menu bar. This will draw a box around the cave. In order to see all aspects of the box, you have to be in profile mode and rotate both the pitch and yaw rotation of the cave.
Controlling Shadow Boxes and Grids. You have complete control over the appearance of the Shadow Box. To make changes in the Shadow Box select the "Preferences->Set Shadow Box" option from the menu bar. The window that comes up will contain two sections, one to set Shadow Box options and the other for Grid Options.
Shadow Box Options. There are several options that allow you to control the appearance of the Shadow Box:
1. Walls. You have the option of showing any one of six walls around the cave. The choices are: Left, Back, Front, Right, Top and Bottom. Different combinations of walls give different effects. For example, normally you might display the Bottom, Left and Back wall. However, if you want to display the cave from the north, you would probably use the Bottom, Right and Back walls.
2. Mirroring. The Shadow Box option allows you to mirror a flattened image of the cave on the sides of the box. These options allow you to select which sides the mirrored image will be displayed on.
3. Wall Offset. This option allows you to move the walls nearer or further from the cave. In some instances, the image looks better if the walls are moved away from the cave. |
|
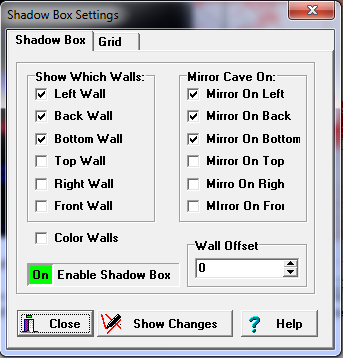
4. Color Walls. This option allows you to fill the walls with a solid color. This can improve the contrast and make the cave and grid lines easier to see. You can set the wall color using the Viewer’s color and font options. Note. Since the grid can be rotated, you should use True Type or Vector Fonts because other types of fonts cannot be rotated. Also, you must use Vector Fonts with most plotters
Grid Options. The Grid is a set of lines drawn at regular intervals on the walls of the Shadow Box. The grid lines can be drawn without the Shadow Box, so they can also serve as a map grid.
1. Show Which Grid. This option controls which walls the grid will be drawn on. For example, if you choose "Bottom," the grid will be drawn under the cave.
2. Spacing Options. This option allows you to set the spacing between grid lines. Since the vertical and horizontal grid lines have very different ranges, the program allows you to control horizontal and vertical grids separately. You can control the spacing between grid lines in two ways:
|
|
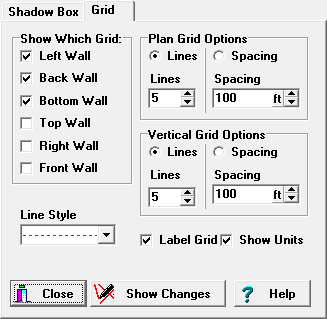
Lines. The first method allows you to set the number of lines on the grid. For example, if you select six lines, six lines will be drawn at even intervals across the grid. Since the number of lines is fixed, the spacing between the lines varies according to the range of the grid. To enable this option, press the “Lines” button and then set the number of lines.
Spacing. The second method allows you to select a specific spacing for the grid line. In this mode, the grid lines will fall on even multiples of the setting you choose. For example, if you selected 100 meters, the grid lines would fall on even multiples of 100 like -1100, -1000, -900, etc. To enable this option, press the “Spacing” button and then set the spacing between lines. The units will be feet or meters depending on the current settings.
3. Line Style. This option allows you to set the type of line that is used to draw the grid. Various combinations of solid, dashed and dotted lines are available. The current line style is displayed in the box. To select a different line style, press the button to the right of the box. A list of all possible line styles will drop-down. Simply select the line of your choice using the mouse. . You can set the line color using the Viewer’s color and font options.
4. Labels And Units. You can label each of the lines in the grid with its position by selecting the "Label Grid" option. You can also add the feet or meters units to the Label by selecting the "Show Units" option. The labels use the currently active units settings.