The main section displays a list of the loops in the cave. Only a few loops are shown, but you can view additional loops by scrolling the display. The columns information in the list has four sections: the Closing Shot, Relative Error Levels, Absolute Error and Overall Loop Quality.
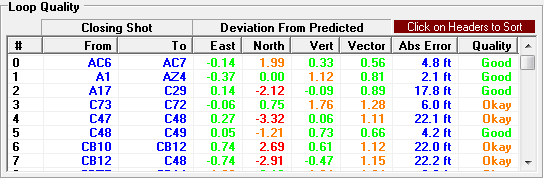
Sorting Columns. When you are working to resolve Blunders, the best strategy is to focus on the biggest blunders first. To facilitate finding the biggest blunders, the program allows you to sort the any of the columns in the list by clicking on the specific column header. Clicking once sort a column header sorts it in descending order. Clicking again sorts it in ascending order. To return the list to its original order, click on the header for the first column. |
|
|
Here is description of each column in the list
1. Closing Shot. The first item on each line shows the closing shot of the each loop. Basically, the closing shot is the shot that actually closed the loop and it is used to identify and distinguish different loops.
2. Relative Error Levels. The second item shows a numerical evaluation of the relative error values for each loop. There are four numbers displayed: East, North, Vertical and Vector. Each gives an evaluation of a different aspect of the loop errors. For example, the East value gives an evaluation of the quality of the east/west part of the loop error. The Vector value combines the north, east and vertical parts into one number and gives an overall indication of the loop error level.
These numbers indicate how closely the errors match the predicted error level for the loop. Small numbers in the range of 0 to 2 indicate that the loop closely matches the expected error level. Large numbers greater than 3, indicate that the error level is significantly greater than the predicted level and indicate a problem with the loop. (In mathematical terms, these numbers represent the number of standard deviations these numbers vary from the predicted norm.)
The numbers are also color-coded to make it is easier pick out the good and bad values. Values between zero and one are colored green. Values between one and two are color coded yellow. Values greater than two are color-coded red.
3. Absolute Error. This is the length of error in Feet or Meters. It is less useful for measuring the quality of a loop than Relative Vector error described above. This is because even well surveyed loops will have large absolute errors when they get longer.
4. Loop Quality. The loop quality column summarizes the overall quality of the loop. It uses the vector value and judges the loop to be "Good" if the value is between zero and one. It judges the loop "Okay" if the value is between one and two. It judges the loop to be "Bad" if the value is greater than two.