The SVG Exporter is a Compass program designed to export cave data as SVG Files. SVG stands for Saleable Vector Graphics, and it is very useful to cave cartographers because it can be loaded into a variety of drawing programs.
The following is a step-by-step tutorial on using the SVG Exporter.
1. SVG Exporter. To Export a Compass file in SVG, you must have the SVG Exporter installed on your computer. (You can download copy from the Compass Web Site at https://www.fountainware.com/compass/downloads/download.htm)
2. Load Plot File. Make sure that the cave survey data that you want to export has been compiled and you have a plot file (*.plt). (If you don't know how to do this, read the Compass Project Manager help file.)
Run the Exporter and then select the "File ->Open" option from the menu bar. Select the plot file you want to export. |
|
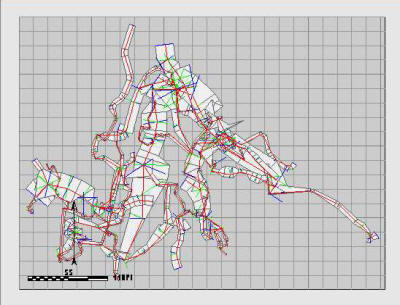
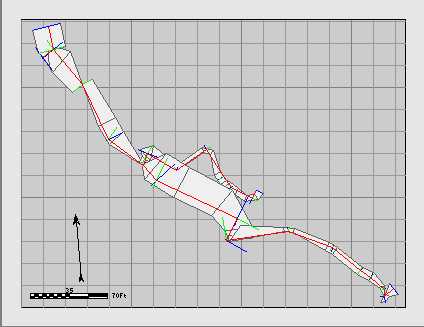
An image of the SVG map will appear in the center of the program. The image shows you and exact representation of what will be exported in the SVG file. If you open the file in a drawing program like Inkscape or Illustrator, they image should almost identical. The gray border represents the margin of the paper. The darker gray color represents the background of the map.
|
|
You should be able to see a grid, passages, shots, a scale bar and north arrow. All of these items are put different layers so they can hidden in the exported map and only displayed when you want. |
|
3. Choosing Sections/Surveys. You may only want to have a map of certain surveys. As a result, the SVG Exporter allows you selectively export any combination of individual sections or surveys. For example, for our tutorial, I will be focusing on the B-Survey in Fulford Cave (A copy of this cave is included with with the Compass distribution.) |
|
On the left side of the program you will see a list of all the Sections and Surveys in the cave. If you have multiple Sections, you can expand a section by clicking on the small [+] symbol to the left. This will display all the surveys it contains. Each Section and Survey has a small "check box" to the left. Clicking on the checkbox enables that survey. To enable the ability to include or exclude surveys, check the "Exclude Sections/Surveys" box at the bottom of the list. When you do this, only the surveys that are checked will be displayed. |
|
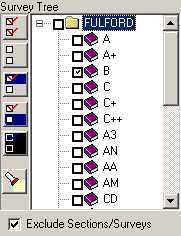
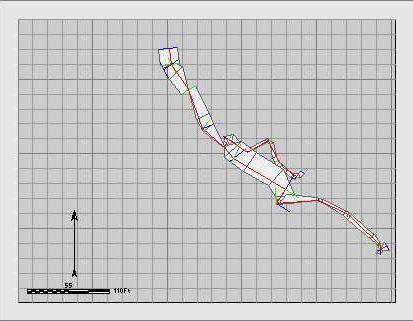
In this tutorial, we only want to export the B-Survey, so only the the B-Survey checkbox has been enabled. The image to the right shows the map with only the B-Survey displayed. You can enable any combination of Sections and Surveys by selectively checking the corresponding check boxes. The buttons to the left of the list allow you to quickly enable or disable large blocks of surveys. This is described in detail in Exporter help files |
|
4. Position, Scale and Rotation. The cave can be positioned, scaled and rotated any way you want. You can adjust the cave using the "Pos/Scale" tab on the left hand panel. You can display the cave in plan view or profile view. You can use meters or feet in displays and setting. The scale can be set in any one of three different ways. First, you can set it as a ratio. For example, the image to the right show a "ratio" value of 608.03. This means that the cave is displayed so that one foot of paper equals, 608.03 feet in the cave. The exact same ratio applies for meters or any other unit you might use. The scale is also set using Feet/Inch or Meter/cm, depending on which units you are using. Finally, Scale Factor is another way of representing the cave size. With a Scale Factor of 1, the cave just fits on the paper. The Scale Factor is usually the quickest way to set the cave size, because small increments cause the cave size to change rapidly. |
|
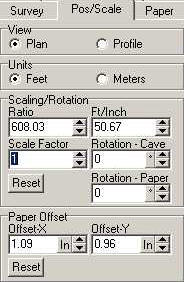
The Paper Offset allows you to move the cave up, down, right and left on the paper. The offset can be in Inches or Centimeters, depending on the Unit's setting. In the case of the B-Survey, I have set the scale to 35 feet per inch, because it is a nice round number and allows the cave to fill the paper. I have also rotated the cave slightly so it fits on the page. |
|
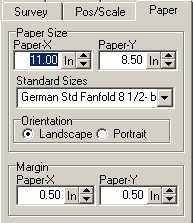
5. Paper Size. The Paper section allows you setup the paper for your map. You can find it by selecting the "Paper" tab on the left-hand panel. You can set the paper size in inches or millimeters depending how the units are set on the Pos/Scale page. There is also a list of common paper sizes that you can choose. Finally, you can set the margin. The program defaults to margins of 0.5 inch or 12mm, because some inkjet printers cannot print Some inkjet printers can't print beyond a certain margin. The Margin option allows you to set aside margin so you can confine you map to the part of the page that then printer can use. |
|
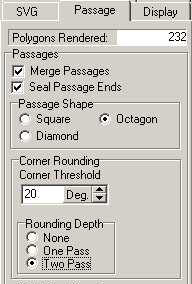
6. Passage Walls. The Passage Walls option controls how the passage models are drawn. It defaults to the simplest possible passage model because the more complicated complex model slows the display and makes the SVG File larger, particularly on a big cave. Switching to a more complex mode can make the passage outlines slightly smoother if you are in plan mode. However if you are generating a profile, switch to a more complex mode can make the outlines much smoother. For profile mode, I would recommend that you set the passage shape "Octagon". I'd also recommend that you set the "Rounding Depth" to "Two Pass". This will make the passage outlines much smoother. |
|
7. SVG Options. The SVG option control aspects of the exported map. The SVG options are accessed by selecting the "SVG" tab on the left-hand panel. Here is a description of each item: |
|
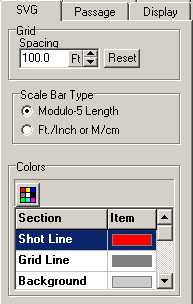
A. Grid. The exported SVG map contains a grid of lines in the background that mark distances. There are heaving and light lines in the grid. The heavy lines are placed a certain distance apart that corresponds to the "Spacing" value" displayed in the "Spacing" box shown to the right. The light grid lines are 1/5 the spacing of the heavy lines. So for example, if the heavy lines are 100 feet apart, the light lines will be 20 feet. B. Scale Bar Type. The exported map also contains a scale bar. The scale bar can be one of two types. i. Module-5 Length. The "Modulo-5 Length" type sets the scale bar length to even multiples of five. For example, the scale bar might be drawn so its length 5, 10, 15 or 20 meters or feet. This is useful when the actual scale is not a round number. For example, if the scale of the map were 97.5 feet per inch, the scale bar would be a length of 100 feet, which would be slightly less than an inch long. ii. Ft/Inch or M/cm. In this mode, the scale bar follows the scale setting for the map. If the scale were 59.7 feet per inch, the scale bar would be 1 inch long and that one inch would represent 59.7 feet. |
|
C. Colors. This option controls the colors of various exported aspects of the map. You can control the color of the Shot Line, Grid Lines, Background, Passage Walls, Passage Fill, Floor Color, From LRUDs, To LRUDS, Station Labels, Station Markers and Frame around the border of the map. |
|
8. Other Options. There are several other options that you can set, but they are crucial to export procedure. Refer to the SVG Exporter help files for more information. |
9. Exporting the Map. When you have the map adjusted so it looks exactly the way you want, you can export it to an SVG file. |
|
First, if you are using Adobe Illustrator 10 or CS1, check the "AI10/CS1 Compatible" option. If don't, the map will appear upside down in these versions of Illustrator. |
|
Next, press the Export SVG and choose the directory and file name you want to use for the file. The program will export the SVG file. |
|
10. Using the File. If you have Inkscape, Adobe Illustrator or certain other drawing programs on your computer, you should be able to double click on the file and it will load and display in the drawing program. At this point you would normally load sketch maps into the drawing program begin drawing passage outlines. For a complete tutorial on drawing a finished map with Inkscape, look in the help files for the Sketch Map editor or on the Compass web site. The tutorial will also work for other drawing programs such as Illustrator, but some of the details will be different. |