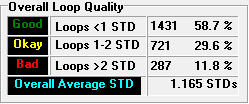
The top of the page displays a summary of the overall quality of the loops in the cave. First, it displays the number of loops that fall in the good, okay and bad Standard Deviation ranges. It also displays the average Standard Deviation value for all the loops in the cave. These numbers give you an indication of the overall quality of the loops in the cave.
