The Source Panel. The Source Panel shows the Source Code for the program. The Source Code is read-only and is not editable in this panel. However, most of the editor's immediate-mode cursor movement commands work, so you can navigate through the source code.
Multiple Editors. Since an XPL program can span more than one source file, the program may open more than one source file. Each source will be on a separate tab page. |
|
|
|
Execution Point. The Source Editor lets you step through parts of the program and monitor what occurs. To do this, the debugger must keep track of the location in code. This location is called the "Execution Point."
The Execution Point is the line in the source code that corresponds to the location of the I2L Program Counter. A dark blue highlight appears in the source code at the Execution Point. Since there may be multiple I2L instructions for each line of source code, the Execution Point points to the first I2L instruction on the line.
When the program first starts or is reset, the highlight bar will appear at the top of the program, usually somewhere in the middle of the variable declarations. This is because the program must execute initialization code that corresponds to the variable declarations and not to the main code or code inside procedures. In fact, if you have used array variables, the execution point may skip from array declaration to array declaration as EXPL initializes and reserves memory for the variables.
The same thing may occur with XPL subroutines, since subroutines can also have array declarations. This means that when you step into a subroutine, the Execution Point may start on the local variable declarations or on the last line of a nested subroutine.
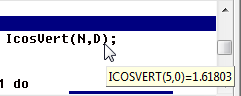
Viewing Variable Values. Variable values can be viewed at any time by moving your mouse of over any variable in the source code. When the cursor moves over a variable in the source code, a pop-up window appears giving information about the variable. |
|
If the variable is in scope, the window will display its current value. If the variable is out of scope, the window will display an "out-of-scope" message. If more than one variable by the same name is in scope, the most local variable is used. If the variable is an array, moving the cursor to the last parenthesis of the subscript will show the current value of the array element specified by the indexes. The program can evaluate any expression in the subscript and will display the final value of the subscript.
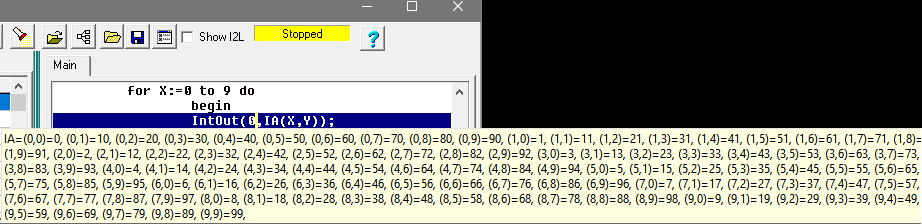
If the variable was declared as an array, the debugger will show all the elements in the array if they will fit on the screen.
Note this feature doesn't work if the array was constructed using the "Reserve" or "RLRes" intrinsics.
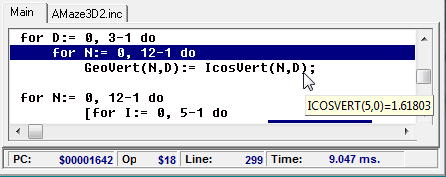
Status Line. At the bottom of the panel is a status display that shows various pieces of information about the state of the program. Here is a description of each item:
PC: This item shows the I2L Program-Counter location.
Op: This item shows the I2L Opcode currently being executed.
Line: This item shows the Line-number of the execution-point in the source code.
Time: This is the time it took for the last line to be executed. It is useful for optimizing code. The value also shows the time it takes for I2L opcodes to be executed when you working the I2L-Panel.
|
|