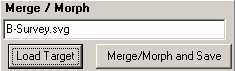
C. Load SVG File. The next step is to load the SVG file for your finished map. On the right-panel, press the "Load Target" button and select the SVG map file. |
|
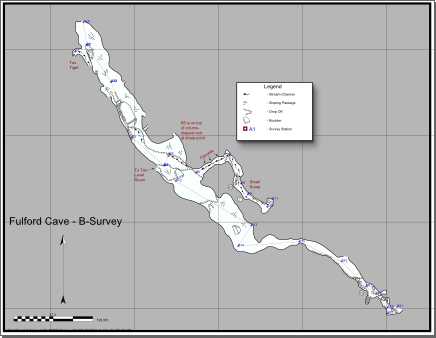
After the map is loaded, the program will have two versions of the cave. One from the plot file and one from your map. At this point, the program will analyze the two versions of the cave and displays the differences side-by-side so you can see the differences. If there are any differences they will be highlighted in pink. Normally, when you first load the data, there will be lots of differences because the plot file is being displayed using default parameters. In this example, you can see that the Scale, Frame Size and Center don't match. This are not problem; just shows where the settings don't match. |
|
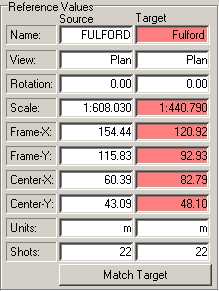
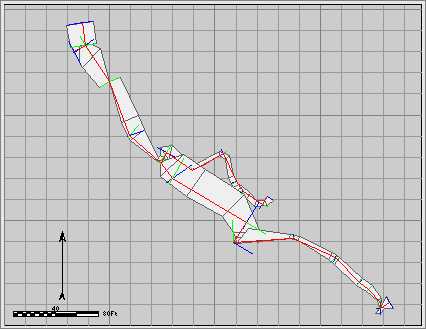
To make the cave display match your SVG map, press the "Match Target" button. The program will set the view of theplot file to match your SVG map. All the boxes should go from pink to white, indicating that the two versions of the cave now match. (Note that in some instances one or two of the values may not go to white and may not exactly match. This is due to rounding errors and is of no concern.) The two images to the right show the matching. The upper image to the right shows the current state of our B-survey map. The lower image shows how the view in the Exporter has been changed to match the SVG File |
|
|