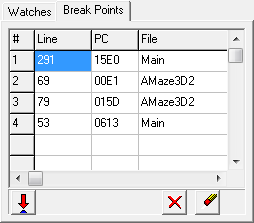
Breakpoint List. The Breakpoint page shows a list of all the active breakpoints. You can access the Breakpoint List by selecting the Breakpoints tab in the left-hand panel.
The list displays the line number, the I2L Program Counter (PC) and the file where the breakpoint is found. Double clicking on a breakpoint will take you to the line of the breakpoint in the Source Code panel.
Breakpoints can be set by clicking on the far left edge of the code in the Source Code panel. This will set a breakpoint on the adjacent line. The line in the Source Panel will be highlighted red when there is a breakpoint on the line. |
|
Here is a description of the toolbar buttons at the bottom of the page:
|
Set Break Button. You can also set a breakpoint by clicking on the Set Breakpoint button.
|
|
Delete Button. Pressing the Delete Button deletes the currently selected Breakpoint from the list.
|
|
Clear Button. Pressing the Clear Button removes all Breakpoints from the list, emptying the list. |
Note: If you close the debugger and make changes to the source code, the breakpoints could shift position if lines are inserted or deleted. If you make changes to the source and go back to the debugger, be sure to check the positions of your breakpoints before using them.