This tool allows you to focus on specific places in memory and display them as strings, integers or reals. It is displayed by selecting the Memory/Heap Analysis tab.
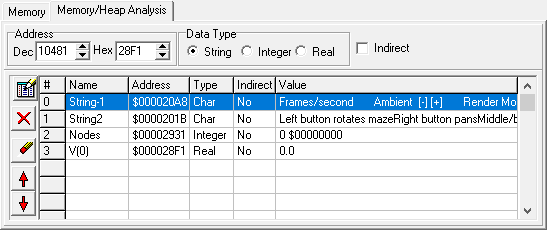
The tool works by allowing you to make a list of individual memory addresses for analysis. Each item in the list will show the content of a specific memory address. You also specify how the content of each memory address should be displayed. For example, you could choose address $1234 and then specify that the content of that locations be displayed as a real. Once you've specified a location, the program update displays of the address whenever an I2L instruction is executed.
There are tool bars along the left and top that allow you to enter and edit list items.
|
Pressing this button inserts one new item in the list. You can specify who the item is displayed using the tools described below.
|
|
Pressing the button deletes the highlight item in the list.
|
|
Pressing this button deletes all the items in the list. |
|
These arrows move the selected item in the list up or down one position. |
Modifying An Item. Once you have add an item, you can modify, by selecting it and then using the options specified below.
Labeling an Item. You give each item in the list a name to help you remember what memory location shows. You simply highlight the item you wish to label, clock on the "Name" column and type the name.
|
This tool specifies the memory address associated with the selected item. The address can be set using decimal or hexadecimal format.
|
|
This option specifies the how the contents of the specified memory address is displayed. You have the choice of String, Integer or Real.
|
|
When this option is off, the memory location is taken to contain the actually variable value itself. When this option is enabled, the memory address is taken to be a pointer to another address that contains the actual value. |
Saving The List. You can save the list using the Save Debug Info button on the main Tool Bar.
Right clicking on the grid brings up a menu that provides display options:
1. Program Start. This moves the memory display to first part of the program, which is normally at zero.
2. Intrinsic Data. This moves the memory display to the first byte of the Intrinsic Data section. The Intrinsic Data section is a block of memory between the end of the program and the heap that is used by intrinsics to send array information back to the program. The area currently consists of 1024 bytes of data, not all of which are used.
3. Heap Start. This moves the memory display to the first byte of the heap. The heap is stack-like storage that holds variables for the program. Local variables for subroutines are pushed on the heap, and each level of subroutine nesting uses space deeper in the heap.