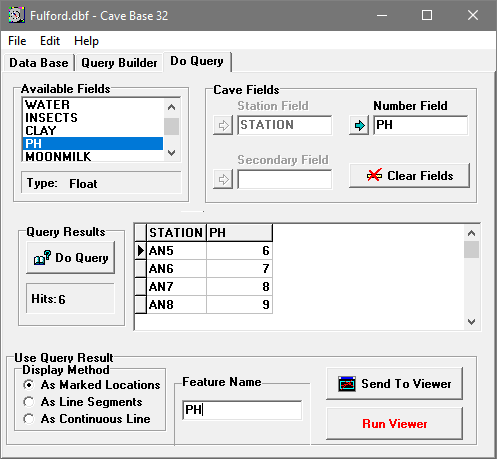
Once you have created a query, you will want to view the result in the COMPASS viewer. You do this by switching to the "Do Query" page of CaveBase.
The Viewer. The Compass Viewer is responsible for display cave data. It also responsible for displaying database information about a cave. As a result, before you can use the data in the Viewer, the Viewer must be running and displaying the cave that matches the database. If the Viewer has been correctly configured, you can run CaveBase directly from the Viewer.
Transmitting And Displaying Data. In order for the Viewer to display database data, it receive the data from CaveBase. There are four steps involved in transmitting data to the Viewer:
1. Select Station Fields. In order for the Viewer to find the location of a particular data item, it must know the station name. As a result, every Compass database must have a field that contains the station name. Before CaveBase can transmit data to the Viewer, you must tell CaveBase which field contains the Station Name. You do this on Do Query page by selecting the field from the "Available Fields" list and clicking on the button to the left of the "Station Field" box.
Two-Part Station Names. Some databases use two fields to hold the station name information. Usually, this consists of a survey name in one field and a station number in another. If your database has this type data configuration, put the second part in the box labeled "Secondary Field." The program will combine these two fields and use it as the station name.
2. Select A Number Field. If you are interested in displaying data that contains numerical values, you can specify a number field. You do this by selecting the field from the "Available Fields" list and clicking on the button to the left of the "Number Field" box. The field must be a numerical, but it can include things like time, date, and currency. The Viewer can display the number or it can use the size of a symbol to represent the number’s magnitude.
3. Do The Query. Once you have built a query and specified the fields that will be returned by the query, simply hit the "Do Query" button. The program will search the database and return all the rows that match the query specification. The selected fields from the matching rows will be displayed in the result grid.
4. Feature Name. You must enter a name for the data so the Viewer can keep track of it. The name will be used to identify the information that will be displayed. For example, if your query target was quartz, you would probably name the feature "Quartz."
5. Display Method. There are several different ways the data can be displayed. The methods are selected by clicking on one of the options in the "Display Method" box. Here is a detailed description of the three methods:
A. As Marked Locations. When you choose this method, the stations can be marked with symbols in the Viewer. This is most useful when you have small number of locations that need to be marked. Marking with a symbol will make the locations standout, even in a forest of passages in large cave.
B. As Line Segments. In this mode, the data is marked by highlighting by the survey shot adjacent to the location. This method is useful you have large number of locations to be marked, and symbols would create a cluttered and confusing display.
C. As a Continuous Line. This option draws a continuous line between every location. This is useful for setting up route-maps through the cave. Because the lines are not tied to surveys they can draw lines through surveys without any side branches. The lines are drawn in the order they are queried from the database so it is important that they are entered in the proper order.
6. Sending Data To The Viewer. You can now send the data to the Viewer. The Viewer must be running before you can do this. If it is not running, you can hit the "Run Viewer" button to start the Viewer. You also have to load the PLT files that corresponds to the database data you want to send.
Once the Viewer is running, you can transmit the data to Viewer by hitting the "Send To Viewer" button. This will initiate a DDE data transfer. If there is a large amount of data, it may take several seconds for the Viewer to process and integrate the information into the plot file. Once the data has been transmitted, it will appear in the "Complex" dialog box as a new survey. For example, if the data we sent was named "Quartz", the word Quartz would appear as the last survey in the list.
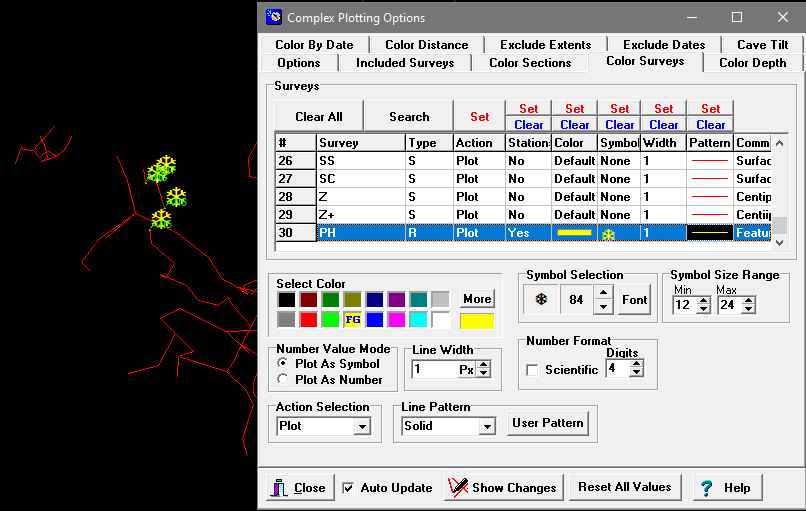
By enabling the "Complex Plotting" and "Color Survey" options, you can color and mark the locations that correspond to the "Quartz" data. Be sure to enable plotting for the feature and select a color and symbol for the feature. For more information about the options available, refer to the Viewer help. Also, once you have transmitted one or more queries to the Viewer, you can save the plot file for later viewing. You do this using the "Save Plot File" option in the Viewer's menu bar.