The Surveyor Details window show detailed information about survey history of one individual surveyor. The window is divided up into two page.
1. Data Page. The data page contains a report on the survey history of an individual surveyor. It includes a count of the number of surveys the person worked on as wells as the combined length and shot count for those surveys. Finally, it lists all the surveys the person worked on as well as the date of the work.
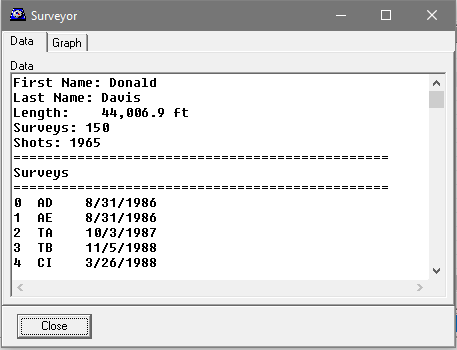
The Clipboard. You can copy and paste the information into another program. Hitting Control-A, will select and highlight all the text in the window. Hitting Control-C will copy all the text to the clipboard. You can also copy smaller portions of the text using the mouse and Control-C
2. Graph Page. The graph page shows a bar graph of when surveys were done. Each bar in the graph represents one months period of time. The height of each bar represent the number of feet or meter surveyed during that month. In this way you can see periods when the person was most active in the cave.
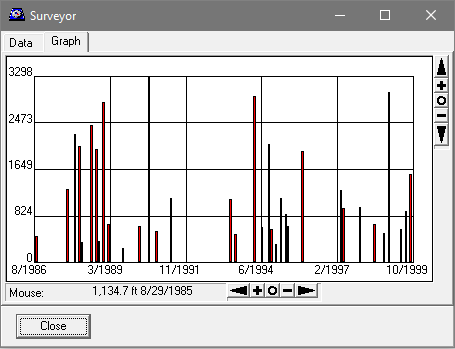
The small buttons along the edge of the allow you to pan and zoom each axis of the graph. The arrow buttons pan the graph in the specified direction. The [+] and [-] buttons zoom the graph in and out, and the [o] button resets the pan and zoom. This allows you to zero in specific dates for more detailed examination.
When you move the mouse across the graph, the mouse position is translated into the corresponding date and length of survey. In this way you can measure precisely how much surveying the person did at a specific time.
Saving The Graph. You can copy an image of the graph to the clipboard, by right clicking on the graph and selecting the "Copy" option from the drop-down menu. Likewise, you can save an image of the graph as a bitmap by right clicking on the graph and selecting the "Save Bitmap" option from the drop-down menu.