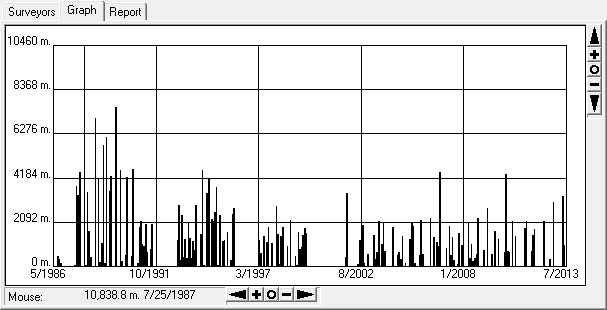
The Survey Graph shows a bar graph of when surveys were done. The graph shows the survey work for all surveyors in the cave. Each bar in the graph represents one months period of time. The height of each bar represent the number of feet or meter surveyed during that month. In this way you can see periods when surveying was most active in the cave.
The small buttons along the edge of the allow you to pan and zoom each axis of the graph. The arrow buttons pan the graph in the specified direction. The [+] and [-] buttons zoom the graph in and out, and the [o] button resets the pan and zoom. This allows you to zero in specific dates for more detailed examination.
When you move the mouse across the graph, the mouse position is translated into the corresponding date and length of survey. In this way you can measure precisely how much surveying the person did at a specific time.
Saving The Graph. You can copy an image of the graph to the clipboard, by right clicking on the graph and selecting the "Copy" option from the drop-down menu. Likewise, you can save an image of the graph as a bitmap by right clicking on the graph and selecting the "Save Bitmap" option from the drop-down menu.