The Debug Console enables you to single step through a program, set breakpoints and view variable values. The Debug Console can be accessed by selecting the Debug -> Debug Console option from the Menu Bar.
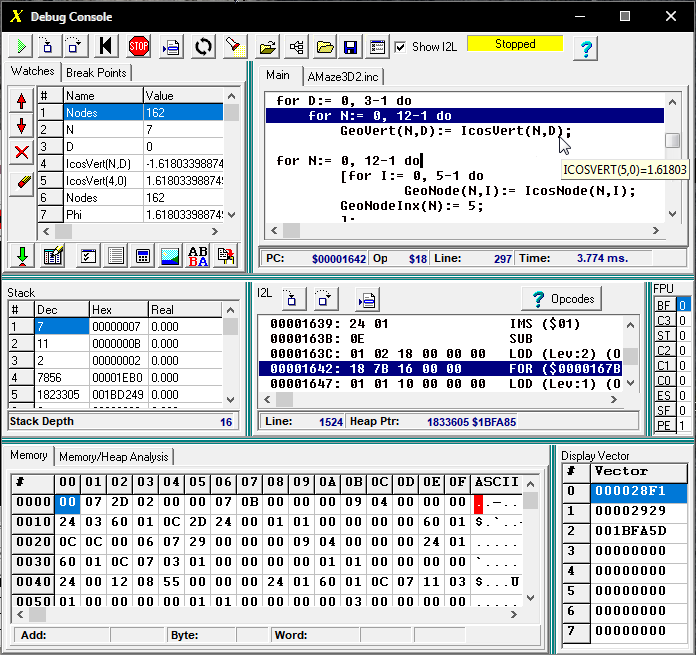
The Debug Console is divided into three main sections and five subsections. The top panel shows High-Level debugging information. The middle panel shows Low-Level debugging information at the Intermediate Interpreted Language (I2L) level. Finally, the bottom panel shows a hex dump of the program's main memory.
I. High-Level Debugging Information: The top panel is divided into two sub-panels. The left-hand panel displays Watch and Breakpoint information. The right-hand panel displays the Source Code.
1. Source Toolbar. The buttons on the Source Toolbar control most of the high-level operations of the Debugger. Click here for detailed information about the Source Toolbar.
2. The Source Panel. The Source Panel shows the Source Code for the program and visual representations of the Execution Point, Breakpoints and variable values. The Source Code is read-only and is not editable in this panel. However, most of the editor's immediate-mode cursor movement commands work, so you can navigate through the source code. Click here for detailed information about the Source Panel.
3. Left-Hand Panel. The left-hand panel contains information about breakpoints and variable watches.
A. Breakpoints. The Breakpoint list shows all the active breakpoints. Click here for detailed information about Breakpoints.
B. Watches. Watches allow you to display the values of several variables at once. Click here for detailed information about Watches.
II. Low-Level Debugging Information. The bottom panel contains low-level debugging information. The panel is only visible if the Show I2L check box is enabled.
The bottom panel is divided into three sub-sections. The left-hand panel displays the I2L Stack, and the right-hand panel displays I2L Opcode information.
1. Stack Panel. The Stack Panel shows the state of the I2L stack. Click here for more detailed information about the Stack Panel.
2. I2L Panel. The I2L Panel shows a disassembly of the I2L code used in the program and the current I2L opcode being executed. Click here for more information of the I2L Panel.
3. FPU Registers. This section shows the values of the floating point processor's status bits. Click here for details information about the FPU registers.
III. Memory Dump and Memory Analysis. This panel allows you to view and analyze the program's memory. Click here more information about viewing and analyzing memory.