The Color-By-Survey option allows you to control the way the cave is displayed on a survey-by-survey basis. This option does more than just allow you to individually color surveys, it also allows you to individually exclude, label and mark surveys.
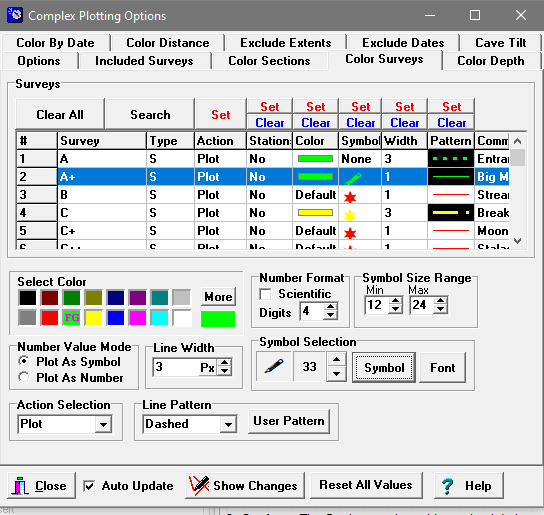
The Color-By-Survey Page. The Color-By-Survey Page displays a list of all the surveys in the cave. The columns to the right of each survey name display the properties for that survey. You can select any survey by clicking-on it. This will highlight the survey. You can also select multiple surveys by holding down the mouse button and dragging it across a group of surveys.
Properties. Once a survey or surveys are selected, you can set its properties by clicking-on the buttons at the top of each column. Here are detailed descriptions survey properties:
1. Survey. This is the name of the survey. Survey names usually consist of the letter part of each station name.
2. Type. The item indicates the type of data in the survey. Here is a description of the possible types:
|
|
3. Stations. The Stations option adds station labels to whatever type of plot is being displayed. Pressing the “Set” button at the top of the column enables Stations for those surveys that are highlighted. Pressing the “Clear” button disables Stations for those surveys that are highlights. The type of station label or marks that will be displayed is controlled by the Station Handling options.
4. Action. The Action property controls the basic way the survey is handled. There are three possible actions: Plot, Exclude, Stations and Depth.
a. Plot. The Plot Option causes the survey to be plotted normally, using the specified color.
b. Exclude. The Exclude option excludes the survey from plotting.
c. Stations. The Stations option plots the survey line and labels or marks each station according to the Station Handling options.
d. Depth. The Depth option plots the survey, coloring it by depth. The range, spacing, thickness and color spectrum are controlled by the Complex Color-By-Depth settings.
e. Passage. The Passage option causes the plot to be drawn using the 2D and 3D passage modeling features in Compass. The style of the passage modeling is controlled by the Passage Modeling dialog box.
The Action property is set via the "Action Selection" box on the page. The box displays the current active Action. Clicking-on the button to the right of "Action Selection" will display a list of other options. When you click-on the "Set" button at the top of the Action column, all the selected surveys are set to the current Action.
5. Color. The Color property controls the color that is used to plot each survey. You can use any color in the “Select Color” grid that appears toward the bottom of the window. To select a color, simply click-on a specific color in the grid. Once you have selected a color, click-on the “Set” button at the top of the Color column. All selected surveys will be set to the new color. If you click on the “Clear” button, the color will be set to the “Default” color, which is the Line Color used for normal plotting.
6. Symbol. The Symbol option allows you to mark special features in a cave with symbols. The Symbol option only works on special Feature data. They have no effect on normal cave surveys. When the Symbol option is enabled, the program places symbols near the location of specific features in the cave. The symbol size can be varied based on numerical values associated with each feature.
Symbol Fonts. The symbols that are used to mark cave features come from special Windows fonts that contain symbols instead of characters. For example, the Viewer uses "WingDings" as the default font for its symbols. WingDings have more than 200 symbols including circles, squares, stars and crosses.
Selecting Symbols. Symbols are selected using the “Symbol Selection” box near the bottom of the window. The currently active symbol appears in the box along with an "index" number of the symbol. The index number makes it easier locate a particular symbol. The arrows buttons allow you to cycle through all the different symbols in a font. You can also select a different symbol font by pressing "font" button. Some of the other "symbol" fonts that are available in Windows are "Symbol" and "Symbol-B." Generally speaking, you want to stick with "True Type" or "vector" fonts because they are scalable. (You also can create your own symbol set using shareware tools for creating fonts.)
Symbol Grid. You can also select symbols by viewing all the symbols at once. That makes it easier to see all 255 symbols and choose one that meets your needs. You do this by pressing the "Symbol" button. This brings of the characters set dialog.
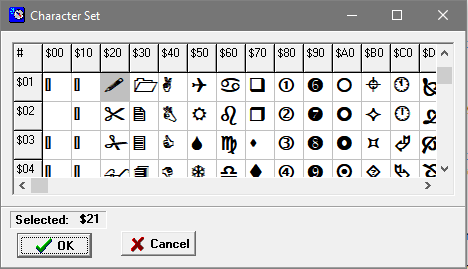
To choose a symbol, simply click on the symbol you want and press the "OK" button.
Setting Symbols. Once you have chosen a symbol, you can set the symbol for a particular survey by selecting the survey and then clicking-on the "Set" button at the top of the column. The symbol is always plotted using the Color property associated with the survey.
7. Width. The Width option allows you to change the width of the plot lines for a specific survey. Pressing the “Set” button at the top of the column sets the Line Width of all highlighted surveys. The value is taken from at the Line Width control at the bottom of the page. Pressing the “Clear” button sets all the Line Widths to one for those surveys that are highlighted.
8. Pattern. The Pattern option allows you to change select a dot/dash pattern for the plot lines for specific Surveys. Pressing the “Set” button at the top of the column sets the Pattern of all highlighted surveys. The value is taken from at the Line Pattern control at the bottom of the page. Pressing the “Clear” button sets all the Line Patterns to Solid for those surveys that are highlighted. Click here for detailed information about the dot-dash patterns, including how to create custom patterns.
9. Number Value Mode. Feature data can also carry a numerical value with each item. For example, the numerical value could represent the water temperature of a cave stream. This type of information can be displayed in the cave plot in two ways: by the Symbol Size or by printing the number. To select the mode, you choose either the "Plot As Symbol" or "Plot As Number" from the Number Value Mode buttons.
If you choose the "Plot As Symbol" the symbols will vary in size according to the "Values" associated with feature. For example, if you are tracking stream temperature, the size of the symbol would increase as the water temperature goes up.
10. Symbol Size Range. Since one of the options for displaying numerical values is to vary the size of symbols, you have the option of controlling the range of symbol size. This is done with the "Symbol Size Range" box. The “Min.” value is the smallest symbol and the “Max.” is the large value. If, for example, you want to display the PH of cave water and you have set a symbol range of 8 to 24, the sample with the lowest temperature would have an 8 point symbol and the sample with the highest temperature would have 24 point symbol.
11. Number Format. If you choose to display values as numbers, you can control the number format. If you select "Scientific," the numbers will be in Scientific Notation (1.2345E+23). The "Digits" value controls the total number of digits in the number. If "Scientific" is not selected, the number is displayed in "Fixed Point" format (12.345). The "Digits" value also controls the number of digits displayed to the right of decimal point.