The Color-By-Section option allows you to selectively plot or color individual sections in the cave.
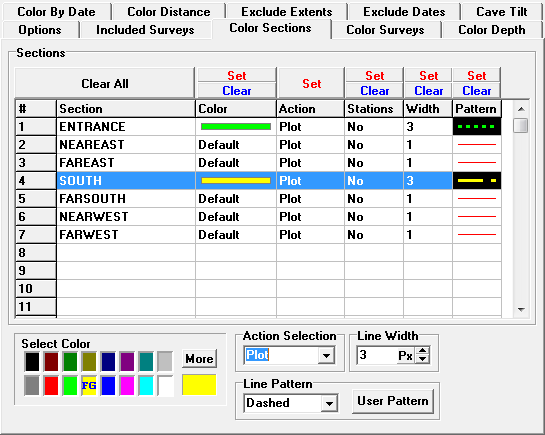
The Color-By-Section Page displays a list of all the sections in the cave. The columns to the right of each section name display the plotting properties for that section. You can select any section by clicking-on it. This will highlight the section. You can also select multiple sections by holding down the mouse button and dragging it across a group of surveys.
Properties. Once a section or sections are selected, you can set its properties by clicking-on the buttons at the top of each column. Here are detailed descriptions of section properties:
1. Section. This is the name of the section. It is based on the name of each file in your project.
2. Color. The Color property controls the color that is used to plot each section. You can use any color in the “Select Color” grid that appears toward the bottom of the window. To select a color, simply click-on a color in the grid. Once you have selected a color, click-on the “Set” button at the top of the Color column. All selected sections will be set to the new color. If you click on the “Clear” button, the color will be set to the “Default” color, which is the Line Color used for normal plotting. |
|
3. Action. The Action property controls the basic way the section is handled. There are four possible actions: Plot, Exclude, Stations and Depth.
a. Plot. The Plot Option causes the section to be plotted normally, using the specified color.
b. Exclude. The Exclude option excludes the section from plotting.
d. Depth. The Depth option plots the section, coloring it by depth. The range, spacing, thickness and color spectrum are controlled by the Complex Color-By-Depth settings.
e. Passage. The Passage option causes the plot to be drawn using the 2D and 3D passage modeling features in Compass. The style of the passage modeling is controlled by the Passage Modeling dialog box.
The Action property is set via the "Action Selection" box on the page. The box displays the current active Action. Clicking-on the button to the right of "Action Selection" will display a list of other options. When you click-on the "Set" button at the top of the Action column, all the selected surveys are set to the current Action.
4. Stations. The Stations option adds station labels to whatever type of plot is being displayed. Pressing the “Set” button at the top of the column enables Stations for those sections that are highlighted. Pressing the “Clear” button disables Stations for those sections that are highlights. The type of station label or marks that will be displayed is controlled by the Station Handling options.
5. Width. The Width option allows you to change the width of the plot lines for a specific Section. Pressing the “Set” button at the top of the column sets the Line Width of all highlighted sections. The value is taken from at the Line Width control at the bottom of the page. Pressing the “Clear” button sets all the Line Widths to one for those sections that are highlighted.
6. Pattern. The Pattern option allows you to change select a dot/dash pattern for the plot lines for a specific Section. Pressing the “Set” button at the top of the column sets the line pattern of all highlighted sections. The value is taken from at the Line Pattern control at the bottom of the page. Pressing the “Clear” button sets all the Line Patterns to Solid for those sections that are highlighted. Click here for detailed information about the dot-dash patterns, including how to create custom patterns.