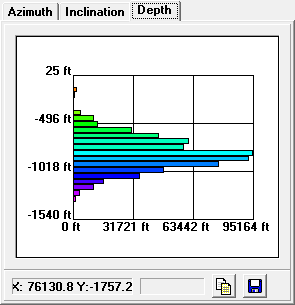
The Depth Histogram shows a graph of the depths of all the passages in the cave. Each bar represents a particular depth in the passages. The width of the bar indicates the range of depths represented by the bar. The length of the bar represents either total length of all the passages at that depth or the total number of passages at that depth.
Showing The Depth Histogram. You can view a depth histogram of the cave by selecting the “Depth” page and then pressing the “Process” button at the bottom of the window. There are several options that control the appearance and operation of the graph. Finally, there are several interactive features that you can use to analyze the graph. |
|