A Rose Diagram is a circular graph that looks like the petals of a flower. Each petal represents a direction and the lengths of the petal show the value associated with each direction.
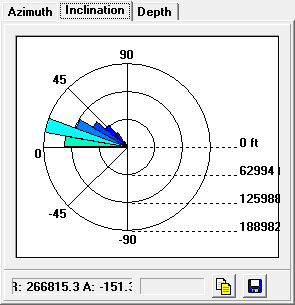
The Inclination Rose. The Inclination Rose shows a graph of the slopes of the passages in the cave. Each petal represents a particular slope angle of the passages. The width of the petal indicates the range of angles represented by the petal. The length of the petal represents either total length of all the passages at that angle or the total number of passages at that angle. The Viewer allows you to set several Options that control the way the graph is derived and its meaning. To process the cave and display the graphs, press "Process Button" at the bottom of the window.
Showing The Inclination Rose. You can view an inclination rose diagram of the cave by selecting the “Inclination” page and then pressing the “Process” button at the bottom of the window. There are several options that control the appearance and operation of the graph. Finally, there are several interactive features that you can use to analyze the graph. |
|