A Rose Diagram is a circular graph that looks like the petals of a flower. Each petal represents a direction and the lengths of the petal show the value associated with each direction.
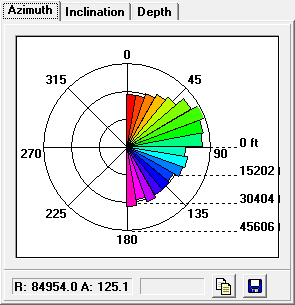
The Azimuth Rose. The Azimuth Rose shows a graph of the angles of the passages in the cave. Each petal represents a particular compass angle of the passages. The width of the petal indicates the range of angles represented by the petal. The length of the petal represents either total length of all the passages at that angle or the total number of passages at that angle. This graph is used to show the dominant direction angles of the passages in a cave. For example, if you see a long petal pointing northeast, you can assume that a large number of passages in the cave run northeast.
Showing The Azimuth Rose. You can view an azimuth rose diagram of the cave by selecting the “Azimuth” page and then pressing the “Process” button at the bottom of the window. There are several options that control the appearance and operation of the graph. Finally, there are several interactive features that you can use to analyze the graph. |
|