Cave passages often develop along fractures in the bedrock. As a result, cave passages can display a pattern that reflects the underlying geology and speleogenesis. For this reason, it can be very useful to analyze the pattern of the passages in your cave.
Graphs Tools. The Viewer can generate specialized graphs that allow you to analyze the patterns in your cave surveys. To access the Viewer graphing tools, select "Tools->Graph Tools" from the menu bar.
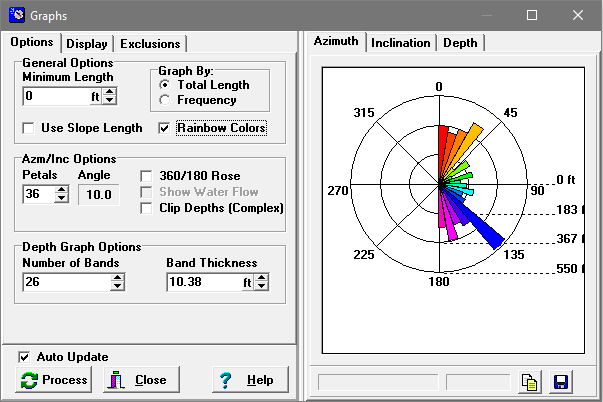
Displaying The Graph. Pressing the "Process" Button, will cause the program to update all the graphs. If "Auto Update" option is enabled, the program automatically updates the display whenever you make a change to the graph parameters. If you have a slow computer or large cave, it may be useful to turn off this feature.
Options. The Viewer has three different types of graphs and many options for controlling the way the graphs are displayed. The options and each type of graph are placed on a separate page of the Graphing window. To select individual pages, simply click-on the tabs at the top of the window. Here are detailed explanations of the graphs and options:
Graphs |
Options |