You can display many types of interesting and useful statistics about your cave data. You can view, save or print these statistics by selecting the "View|Cave Statistics" options from the menu bar. This will bring up the Statistics Window.
As The Loop Closer and Compiler process a cave file, they tabulate statistics. As a result, before you can view statistics, you must process your cave data. You can do this in several ways. If you have used the “Process and View” button to view the cave, statistics may have already been generated. However, depending on how the options have been set, Compass may be working from files on disk and so no statistics will be available. .
|
|
If this is the case, you can use the Process button in the Statistics Window to generate statistics. You can also access this option of by selecting the Run|Process Only option from the menu bar
Which Files Statistics Apply To. The Compiler and Loop Closer only operate on certain files and only retain statistics for certain files. For this reason, the statistical information may be incomplete. There are two main factors that effect what statistics can be displayed:
1. Selected Files. Which files are processed depends upon which have been selected in the survey tree. As a consequence, the statistics you see will depend upon which files have been highlighted in the tree. If an individual survey data file was highlighted when you processed the data, only the statistics for that file will be available. On the other hand, if the survey project was highlighted, statistics for all files in the project will be available.
2. Linking. When you use the linking feature, the Compiler purges data from certain files so that duplicate station names will not conflict. As a result, only some statistics from the first files in the project will be missing. The Project Manager will warn you if the statistics are incomplete with the following message:
Warning! Because of Linking, information has been Purged.
Only the information from the last file(s) will be displayed.
Compiling vs. Closing. When you compile and close the data normally, the Compiler will be using closed data files and thus loop errors will be masked. This can be useful if you want to verify that the Loop Closer is truly closing the cave. However, it you want to analyze loop errors or look for blunders, you must be certain that the Compiler doesn’t use closed data files.
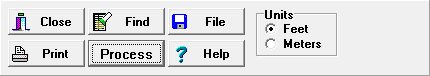
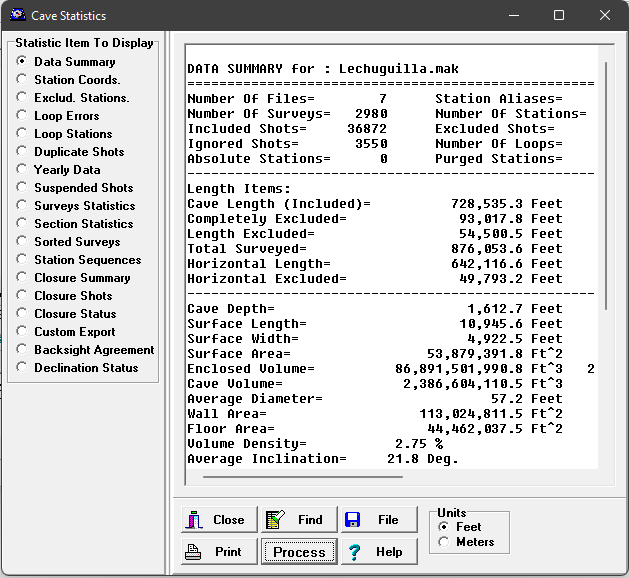
Linear data can be displayed in either meters or feet. To select feet or meters, click on the appropriate option on the lower right.
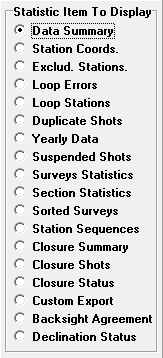
The Statistics Window. There are many types of information that can be displayed. To select a particular category of data, select one of the options in lower left. The selected data will be displayed in the right hand window. |
|
Note: If you are processing multi-file surveys by linking, the program may purge some information from the statistics. This means that some of the statistics apply to all of the files and some of the statistics only apply to the last file processed
Here is a description of each category of data:
Viewing Statistics |
||
General Statistics |
||
Closure Statistics |
||
Errors |
Blunders |
|