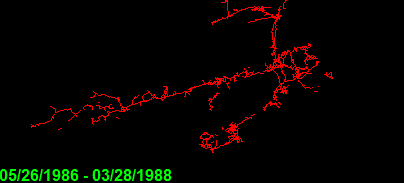
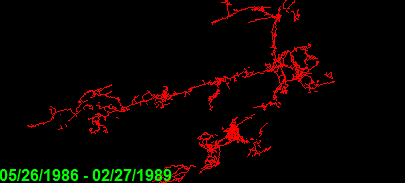
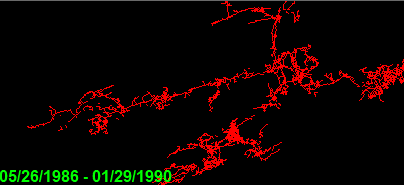
Date Animations display a series of images that show the state of survey mapping at a particular point in time.For example, if a cave was discovered in 2018, the program could display the state of survey mapping up to 2019, 2020, 2021, 2022 and 2023. If there has been a lot of exploration, the program can display exploration month by month, week by week or even day by day. Animating these images shows how the exploration of the cave developed over time.For example, the following image show how Lechuguilla evolved over the first four years of exploration:
|
|
|
|
|

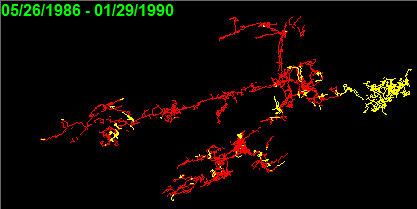
Animations can be set to display color schemes that emphasize the most recent exploration. For example, this image highlights the last year of exploration:
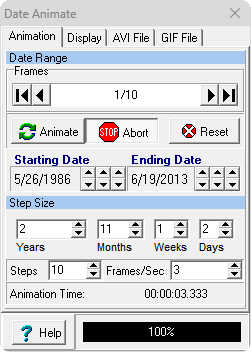
To use the Date-Animation tools, select the "Tools->Date Animation" option from menu bar. This will bring up the Date-Animation dialog:
The Date Animation tool has four pages:
|
|