Printing a cave on a piece of paper is very different from viewing the cave in a window on your monitor. This is because the size and dimensions of the view-screen are very different from the size and dimensions of printer or plotter paper. As a result, the Viewer allows you to view a preview of what the cave plot will look like on the paper. To preview a printout, select the "File->Print->Preview Print" option from the menu bar.
The Preview Screen. The preview screen shows you a simulated sheet of paper and how the cave will appear on that paper. Although the simulated sheet is smaller than the real sheet, everything is scaled so it exactly matches what you will see when the plot is printed. The program communicates with the printer to find the size and orientation of the paper. This means that even if you use landscape mode, legal size paper or even "D-Size” plotter paper, the display will be correct. The program even tests your printer to see if it supports color. (Note: for more information on how the Viewer scales images and plots see Scaling Screen and Plots.)
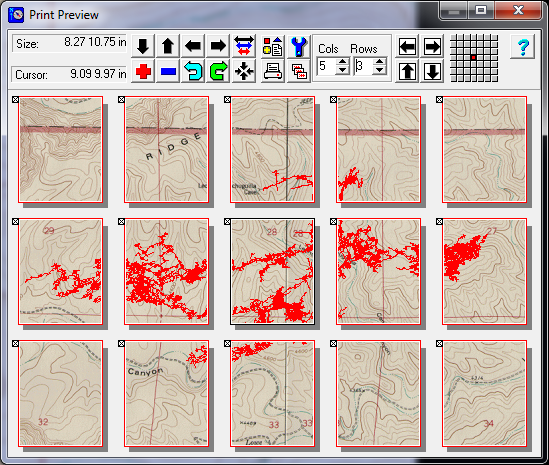
Multi-Page Preview. If you are printing a large cave at a low scale, the map can take up many pages. For this reason, the Viewer allows you to preview more than one page at a time. This allows you to see how each section of the cave will be position on its individual page when it is printed out. The feature also allows you to print all the pages at once, with out having to tediously select and print each page. Click here for more detailed information about multi-page previews and printing.
Legend and Labels. Legends and labels are also scaled so you get an exact representation of what your printout will look like. However, if you choose a non-scalable font for the legend or labels, the text will appear too large and the representation will not match the printout. Only True Type and Vector fonts are scalable, so you should normally choose a font like "Arial" for your printouts.
Line Thickness. If you use thick lines for the plot or the legend, the lines may appear too thick on the preview screen. This is because the simulated sheet of paper is much smaller than a real piece of paper. To compensate for this, the Print Preview screen does not show all possible line thicknesses. It just shows that the lines will be thick or thin. The lines actually printed on paper will have the true thickness.
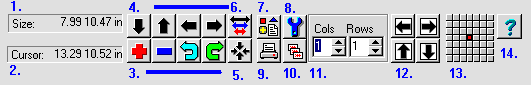
Preview Tools. The buttons and status displays at the top of the preview screen allow you to adjust the plot so that it is properly scaled and centered on the paper. Some the buttons perform the same functions as the Toolbar Functions. The other buttons perform actions that are specific to preview and printing process. Here is a description of the Preview tools:
1. Paper Size. This is a display of the dimensions of the paper being used by the printer. It is not the size of the actual sheet of paper. It is the size of the area on the paper the printer or plotter can draw on. The units used can either be inches or millimeters depending on the units you have selected in the Setting Window.
2. Cursor Location. This is a display of the cursor position on the simulated paper. The position is given in units on the paper. Thus, the cursor allows you to measure the actual position of objects on the paper when you print the cave. The units used to display the cursor can be either inches or millimeters depending on the units you have selected in the Setting Window.
3,4. Pan, Zoom and Rotate. The Pan, Zoom and Rotate buttons allow you to pan and zoom the print preview image. They function identically to the Pan and Zoom and Rotate functions for the viewer screen. This allows you to make adjustments in the final image before it is printed.
5. Tie-In Button. This button allows you to establish the tie-in you set in the Print Options window. This will move the plot so that a specified station will be fall on a specified location on the paper.
6. Toggle Multiplier. Clicking-on this button allows you to change the Action Multiplier.The Action Multiplier controls the amount of change that happens when you click-on the Pan and Zoom buttons. This makes it easy to center and scale the plot on the paper. Generally, you start with large increments to rapidly move the plot into the correct position. Finally, you finish with small increments to fine-tune the position.
7. Set Print Options. Clicking-on this button displays the "Print Options" window. This allows you set special Print Options like the plot border, the overlap between pages and the legend.
8. Setup Printer. This option allows you to set the hardware configuration of the printer or plotter. You can set things like paper orientation, paper size, line color, color quality etc.
9. Print Page. Clicking-on this button causes the program to initiate the process of printing a single page. If multiple pages are displayed, the page with black outline will be printed.
10. Multi-Page Print. Pressing this button causes the program to print all the pages that are selected. This allows you to selectively print dozens of pages with a single operation.
11. Set Number of Pages. This option allows you to set the number pages in a multi-page preview.It controls the number of rows and columns of pages that will be displayed in the Preview window. Each page will be an exact representation of what will be printed on the page when it is printed on your printer.
12. Move By Page. These buttons are used to do multi-page plots. Normally, you will do multi-page plots when you have zoomed or scaled the plot to the point that it will not fit on a single piece of paper. These buttons move the plot by the width or height of a page. To do a multi-page plot, simply plot a page and then move to the next page until the entire cave has been printed. To facilitate splicing each page together, you can set the program so that each page overlaps the next page by a specified amount.
13. Page Position Display. The Page Position Display is used to when you are doing multi-page plots. It gives you a visual representation of which page is currently being displayed and is ready for printing. The Page Position Display consists of a grid of squares. The dark square in the center represents the starting page. Each square represents a page and the red dot shows which square is currently selected.
Each time you click-on one of the move-by-page buttons, the red dot will move to a new square. For example, if you click-on the Page Right button, the red dot will move one square to the right. You can also click directly on the one of the squares to move the display to a different page.