|
|
| Spectracizer - Free
Audio Spectrum Analyzer
|
|
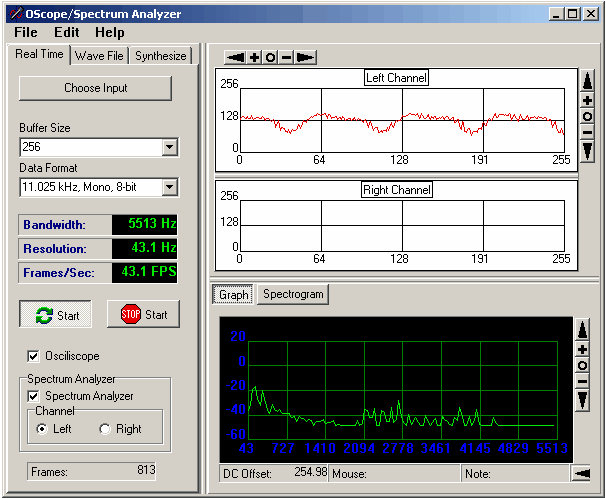
Spectraciser allows you to do audio signal
analysis using your computer's sound card. It can do
real-time analysis of a "live" signal fed to your
computer. It can also do static analysis of an Audio
Wave file. Depending on the Sample Rate and sample size,
it can do bandwidths of 5.5 to 22Khz. It has a
frequency resolution of between 43Hz and 0.3Hz. It also
displays oscilloscope signals of the incoming waveform.
Finally, it can synthesize complex wave forms and
analyze them. |
|
|
|
 |
|
Features |
| 1. Real Time Spectrum Analysis. |
| With the Real-Time analysis option, you bring the audio into
your computer through the sound card. Signal can be in the be in
audio frequency range from about 20hz to 22Khz, depending on
your sound card. |
| a. Spectrum
Graph. The Spectrum Graph displays an analysis of the
current signal. Every signal is a combination of one or more
sine waves. Each peak in the graph represents the frequency of
one of those sine waves. By looking at the peaks, you can
determine the combination of frequencies that are contained in
the signal. |
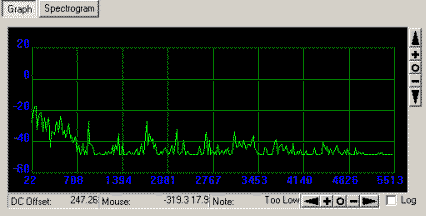 |
| Using the cursor,
you can determine the exact frequency of each peak. If you
analyzing music, you can determine the musical note
represent by a peak. You can zoom and pan the graph so you can
see the details and make precise measurements. |
|
|
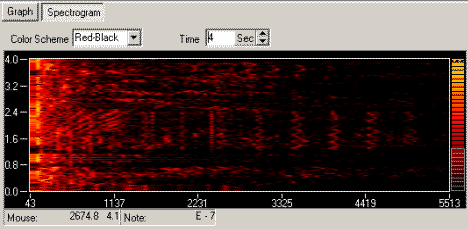
| b. Spectrogram.
A spectrogram displays the changing spectrum over time. The
spectrogram to right shows 4 seconds of time. The yellow and red
spots on the graph show peaks in the spectrum.
You have a choice of different color schemes and
you can even create your own color schemes. You can also adjust
the time period displayed. |
 |
|
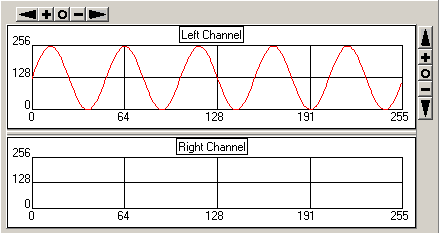
c. Oscilloscope. The oscilloscope
shows the raw signal from the input. It shows the amplitude and the
sample number of the sample.
If the signal is stereo, there are two
graphs so you can see both channels. You can pan and zoom to see the
details of the signal. |
 |
|
2. Sound File Analysis. |
| The program also
allows you to read Windows WAV files and analyze them. You can
pick out individual sections of the file for analysis. |
 |
|
The WAV file data will be
displayed in the Oscilloscope section and you can pick specific
sections of the sound for analysis. The blue lines in the image
above show a section of a file that has been selected for
analysis. This can be very useful to musicians for dissecting a
song to figure out exactly what notes are being played. The
program can also play the selected section of the sound to make
sure you have chosen the right part of the sample. |
| 3. Wave
Synthesis. |
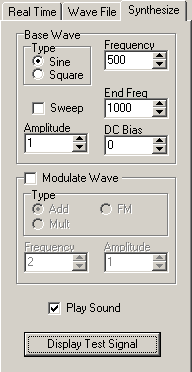
| Virtually any wave form
or sound can be constructed mathematically. Spectracizer
also allows you to generate mathematically generate complex wave
forms and analyze them. Base Wave. The
Synthesize option allows you to generate Sine and Square waves
of any frequency as the base wave from. These frequency can then
be swept between the base frequency and another frequency.
Modulations. The Base Wave can then be
modulated by another sine wave of any frequency. The modulation
can by addition, multiplication and frequency modulation. You
have control of the amplitude of both Base Wave and Modulator
Wave. You have control of the DC Offset of the Base Wave.
Playing Synthesized Sounds. Finally, you can
the sound synthesized sounds through your computer's speakers.
The sounds generate interesting, "Science Fiction" sound
effects. |
 |
| The image to the right
shows a complex wave from generated with the
synthesizer. As you can see, the sound is very complex
and it produces a sound similar to laser pistol you see
in SciFi movies. |
 |
|
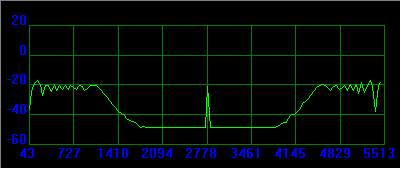
| The image to the right
shows a spectrum analysis of the same complex wave form
displayed above. As you can see, the wave form consists
of a low frequency component, a high frequency component
and a single frequency spike in the middle. |
 |
|
|
|
User License |
| The program is free of charge and
does not contain any advertising or limitations. You are free to
use it however you see fit. However, you may not repackage or
sell the program. |
|
|
|
|