|
ROSE DIAGRAMS AND DEPTH HISTOGRAMS.
|
|
COMPASS has extensive support for graphing Azimuth and Inclination
"Rose" Diagrams. It also has the ability to create Depth Histograms. You
have complete control over the graphs including, the number of bands, band
thickness, the colors and fonts. The graphs can be resized to virtually any
size or shape. You can graph by frequency or total passage length. You can
set a minimum passage length, which allows you to filter out the effects
short passages and more clearly see dominate patterns. You can also focus
on specific depths, which allows you to find different fracture patterns
in different rock strata. You can produce 90, 180, and 360 degree diagrams.
The 360 degree roses can use the passage slope to show water flow direction.
You can click on any of the graphs to highlight all the passages in the cave
that match mouse position on the graph. You can move the mouse across any
of the graphs to get exact angle, magnitude and depths. All graphs can be
copied to the clipboard or saved to a file. Here are some sample images: |
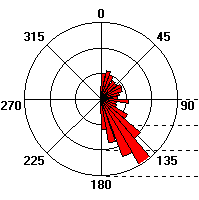
| The 180 Rose Diagram. This image shows the basic 180 angle Rose
Diagram. All angles greater than 180 are reversed so you can see the actual
passage trends, not the directions passages were surveyed. The petal width
on all graphs is adjustable. Here the petal width is 10 degrees. |
 |
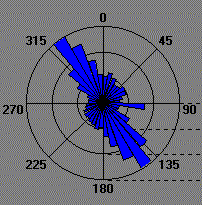
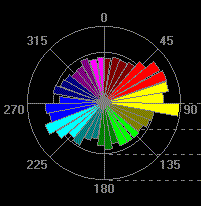
| Graphing By Passage Length. This image shows graphing by passage
length. The length of each petal indicates the total length of passages at
a particular compass angle. This method emphasizes longer passage and obscures
short cross trends. This graph also shows the capability of setting colors
and fonts. |
 |
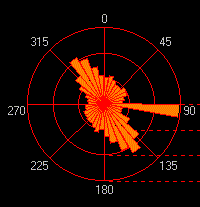
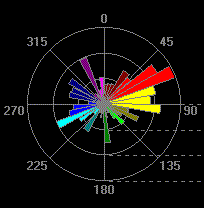
| Graphing By Frequency. This image shows the same cave, but graphed
by frequency. In other words, the length of each petal represents the total
number of shots at a particular angle. This method emphasizes the shorter
passages. Here you can see how the shorter passages have a dominate 90 degree
trend. |
 |
| Water Flow Direction. This image shows the water flow direction
in the same cave. Here the "petals" of the rose are oriented so they always
point down hill. Thus you can see that the water flow direction would be
toward the southeast. |
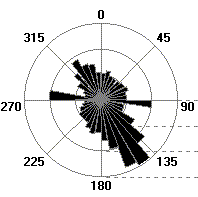 |
| Large Caves. One of the problems doing Rose diagrams on large
cave systems is that there are so many short shots that don't follow the
main passage trends. Here is rose diagram for a large cave. As you can see,
there are lots of short, off trend shots obscure the dominate passage trends. |
 |
| Passage-Length Filtering. With passage-length filtering, the shorter
passages are ignored. Here you see the same cave, filtered by passage
length. By eliminating short passages, the dominate passage trends emerge. |
 |
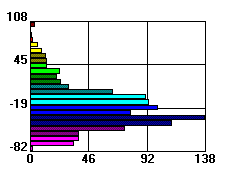
| Depth Histograpms. This image shows the depth histogram. Each
bar represents a specific depth in the cave. The length of each bar can be
the total length of all the passages a particular depth or the total number
of shots at a particular depth. As with all the graph tools, you have
complete control of the width of each band, and the colors and colors and
fonts. |
 |
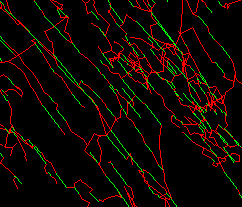
| Highlighting Passages. One of the special features of the COMPASS
graphing tools allows you click on one part of the rose diagrams and highlight
all the passages that match the angle of the petal. In this image you see
a cave plot with all the southeast angling passages highlighted. |
 |