Other New Features
|
Registered Images |
 |
|
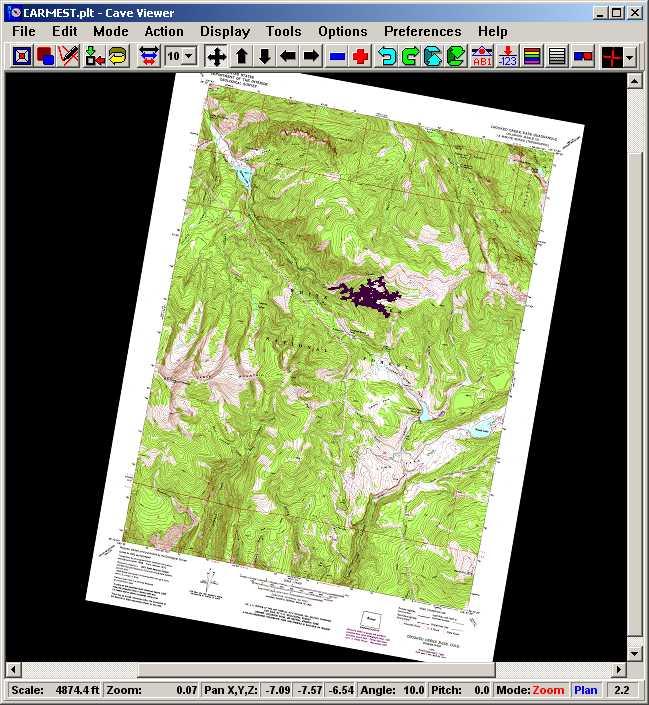
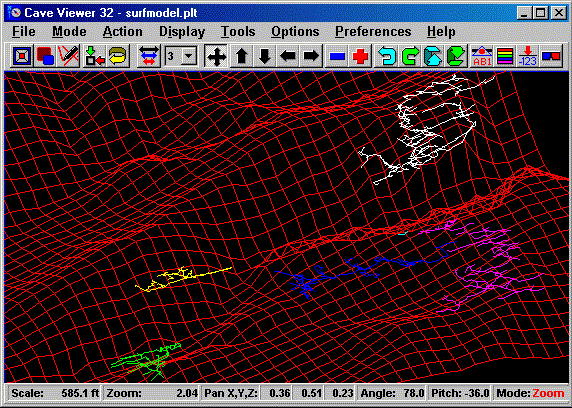
Registered Images. Compass now allows you
to lock an image to the cave plot. For example,
you can lock an aerial photograph or topographic
map such as the one above to the cave. Once the
cave has been locked to an image, the image will
rotate, pan and zoom in synchronization with the
cave, effectively tying the cave and the image together. Images can
be BMP, TIFF, JPG, GIF and PNG. Compass also
allows you to resize and clip the images using
filtering and over sampling algorithms that
minimize artifacts. You can also adjust
contrast, brightness and gamma to improve the
readability of poorly scanned images. |
|
True 3D Rose Diagrams |
|
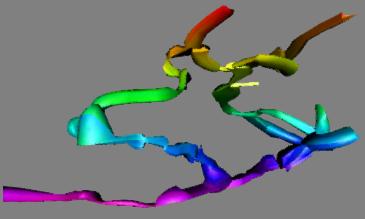
The latest version of CaveX is capable of
producing true 3D Rose Diagrams. These diagrams
show both passage orientation and depth. This
allows you to see passage trends that only exist
at certain depths. |
|
 |
|
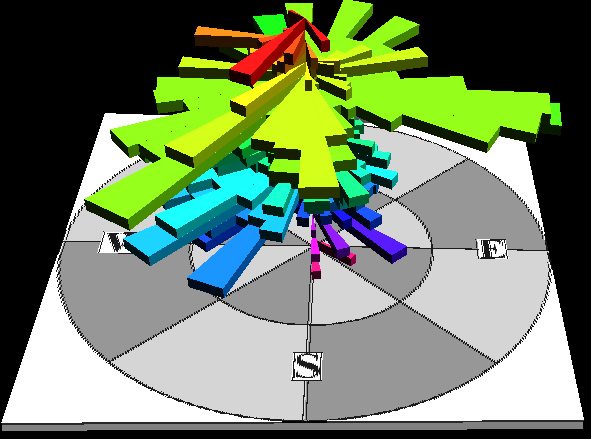
Passage Orientation. Here is a rose
diagram from Fulford Cave. Fulford has two major
passage trends, southwest and east-southeast.
You can clearly see in this diagram that the
eastern trend is confined to the upper parts of
the cave. In the deeper parts of the cave the
trend is missing. |
|
 |
|
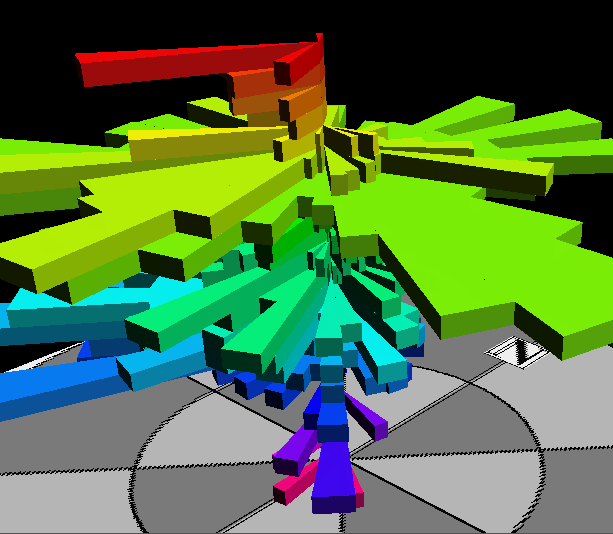
Zoomed View of 3D Rose.
These images can be zoomed, panned and rotated
in real time, which allows you analyze specific
passage trends in detail
The picture above shows the same rose diagram
zooming into the southeastern-trend area. Here
you can see that the east-southeast trend
quickly disappears but there is a pure southeast
trend that appears in the deepest parts of the
cave. This kind of detailed analysis is
impossible with ordinary 2D Rose diagrams. |
|
Instantly Identify Stations or Edit Surveys. |
 |
|
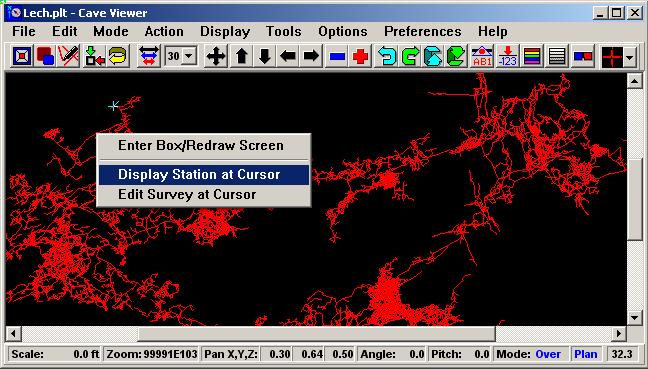
New Right Click Menus. New right click
menus allow you to quickly identify stations and edit
surveys based on the cave passage under the cursor.
(You will also notice the scroll bars on the side
of the window. This is a minor improvement that
makes it easier to view a specific part of the
cave when the window minimized.) |
 |
|
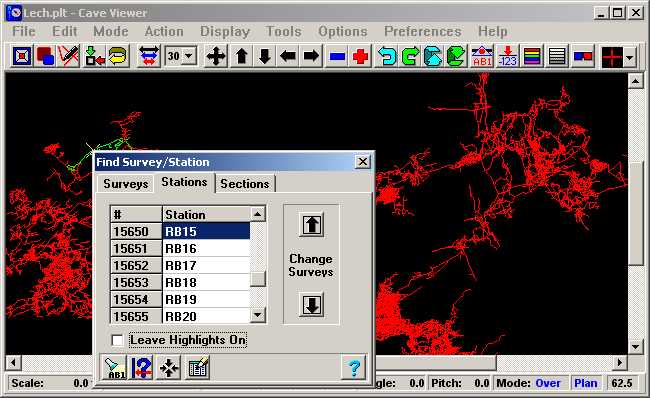
Identifying Stations and Surveys. This
image illustrates the option of identifying
the station under the cursor. Here we have
identified the RB15 station and the rest of the
survey is highlighted in yellow. You also have a
list of the stations in the survey and list of
surveys and sections in the cave. |
|
Color By Distance |
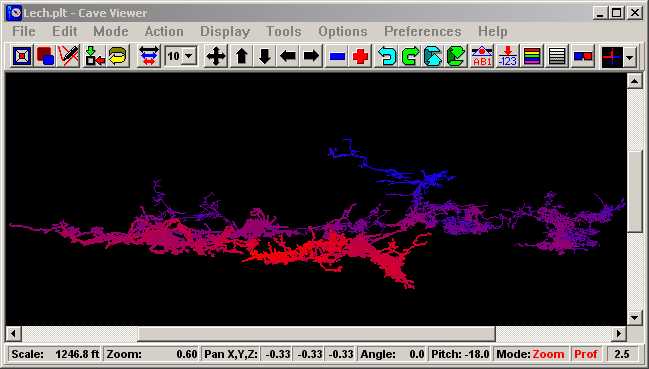 |
Color By Distance. This option colors the
passages according to the distance from the
closest part of the cave. This creates a 3D
effect that makes easier to differentiate far
and near passages. As an example, the image
above colors near passages red and far passages
blue. Because of blue has a shorter wave length
than red, your eye has to focus farther away for
the blue passages. This give the illusion of 3D
without the need for special glasses. You also
have the option of draw near passages thick,
which enhances the 3D illusion.
|
|
 |
|
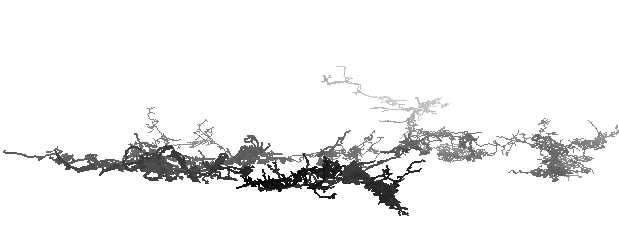
Color Schemes. There are also several
standard color schemes available. The color
scheme above colors distant passage light gray
and near passages black. This creates the same
3D illusion when the cave displayed on a white
background or printed on white paper. |
 |
|
Black Background. This image illustrates
the color scheme used for black backgrounds.
Here the nearby passages are colored white and
the far passages are colored dark gray. You can
also create your own custom color schemes and
gradients. |
|
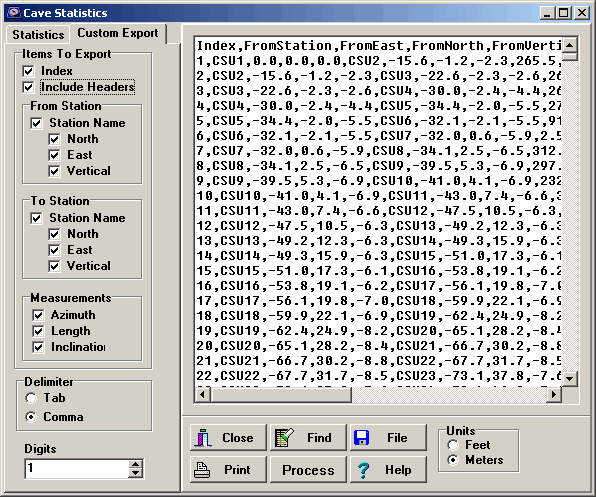
Custom Exporter. |
 |
|
Custom Exporter. The Custom Exporter is a
general purpose export tool that is designed to
export various kinds of cave data to databases
and spreadsheets. You have control over which
items are exported including From Station, To
Station, the Cartesian coordinates for each
station and the Azimuth, Length and Inclination
for each shot. Fields can be comma delimited or
tab delimited. Click here
for more information on Compass export options. |
 |
|
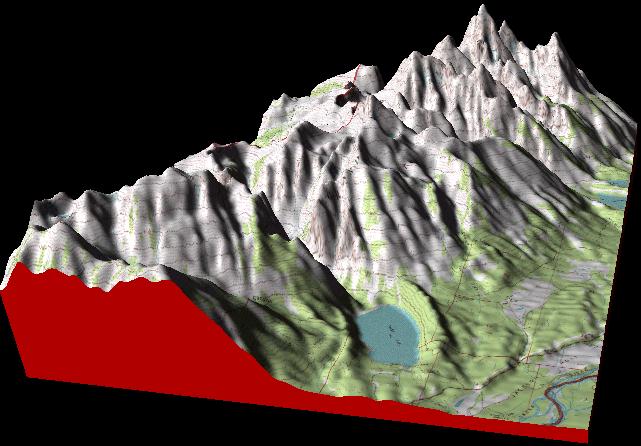
Estierra
Terrain Model of the Grand Teton Mounts |
|
1. |
Estierra - New
Terrain Modeling Program |
Free To Registered
Compass Users |
| Compass has new adjunct program
called Estierra. Estierra
is a program for modeling the terrain of
the earth. It reads standard USGS
Digital Elevation Model files (DEM’s)
and converts them into three-dimensional
models of the earth’s surface. These
models can be colored, shaded,
highlighted and overlaid with
topographic maps or aerial photographs.
This creates extremely realistic 3D
images of the terrain. In addition,
Estierra uses Microsoft’s DirectX
technology that gives it the
ability to do high-speed animations of
the terrains. This means the terrains
can be zoomed, panned and rotated in
real-time. |
If you are a
registered user of Compass, you are
automatically registered for Estierra.
Also comes on the
Compass CD-Rom Package |
| You can
even fly over and through the terrain
using a joystick or mouse. Go to the
Estierra Web Page for complete
information. |
 |
|
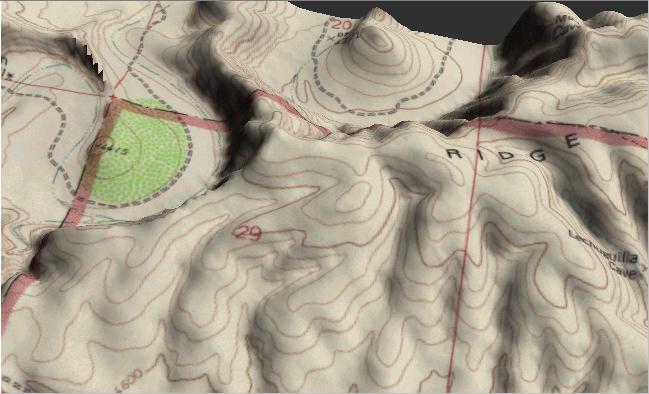
Here is a model of the
terrain around Lechuguilla Cave with a
topographic map overlaying the surface.
The canyon to the northwest is the
Serpentine Bends. The cave appears along
the lower right edge of the image.
Terrains can be overlaid with geologic
maps and aerial photographs with equally
stunning effect. |
|
| 2. |
Integrated 3D Export Tool |
VRML Images |
| Cavers frequently need to export cave
images in a variety of the 2D and 3D Formats. These formats a very
similar, so Compass now has integrated export tool that handles DXF,
Shapefiles and VRML. The Exporter uses the Compass 3D Passage Modeling
Engine to generate the passage models, so all the exported data has high
quality 3D passages. Both the Compass Viewer and CaveX use the 3D tool. |
 |
|
3. |
VRML |
| Compass now supports the
export of 3D cave models as VRML files. VRML stands for “Virtual Reality
Modeling Language”. It is a language designed construct and display 3D
objects. It is especially useful for viewing 3D objects over the
Internet. VRML images can use sophisticated modeling techniques
including Gouraud Shading, spline surfaces, directional lighting,
texturing and high-speed animation to display very realistic images. For
caves, this allows the creation super-realistic looking cave passages. |
Here is a sample VRML Image.
Click here to install a VRML plug-in and
view live, animated VRML cave images. |
| VRML Information |
|
|
| |
|
|
| 4. |
3D Modeling Engine. |
| Over the
years Compass has used a variety of techniques for generating realistic
cave passage models. Unfortunately, each new improvement did not always
get integrated back into other parts of Compass. To deal with this
problem, Compass
now has an integrated 3D Modeling Engine that produces cave passage
models for all Compass programs. This means that all aspects of Compass,
even the export options, now produce very realistic passage models.
Here is demonstration of the passage generation process: |
|
|
|
 |
 |
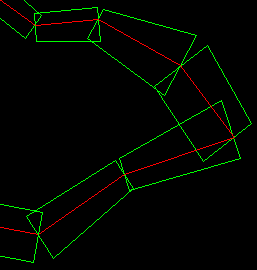
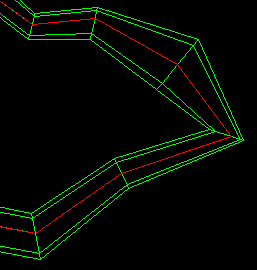
| Step1. This
image shows a simple curved passage with square passage outlines drawn
around the survey shots. |
Step 2. Here we
have changed the passage outline to octagonal. |
|
 |
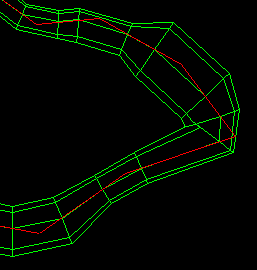 |
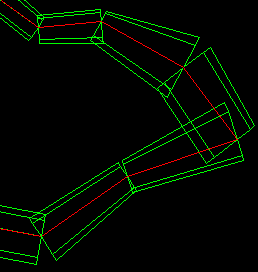
| Step 3. In this
step the ends of each passage segment has been joined to its immediate
neighbors. |
Step 4. In this
step, additional passage segments are added, smoothing transitions
between different size passages |
|
 |
 |
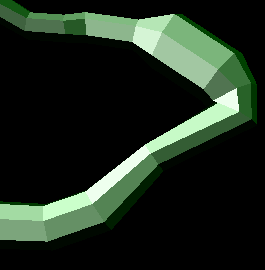
| Step 5. At this point CaveX takes over and adds
solid faces, lighting and shadowing. |
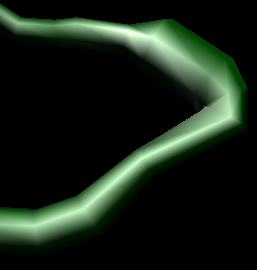
Step 6. Finally, CaveX smoothes the
surfaces using special techniques such as Gouraud shading. |
|
| 5.
|
Transparency Option. |
|
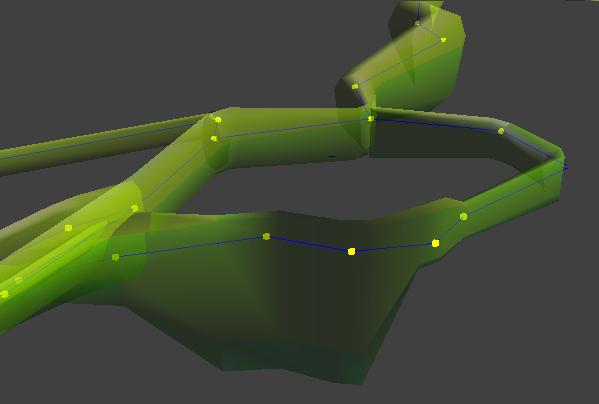 |
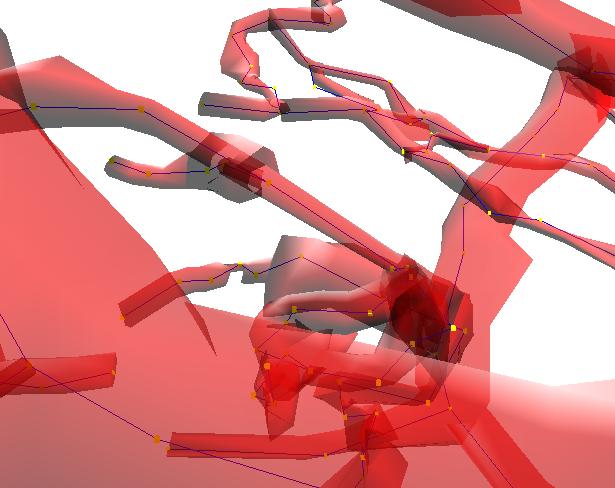
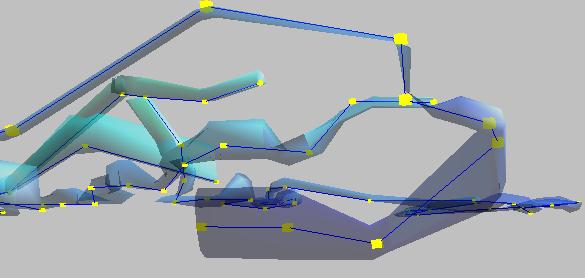
| CaveX's new transparency option allows you to
see the interiors of passages to view the stations and survey shots. Here the shot lines are displayed as blue lines and the
stations as yellow squares. The transparency option is very handy for
viewing intertwined passages and complex three-dimensional caves. |
|
 |
|
 |
|
|
|
| Magnetic
Declination. Compass now calculates
magnetic declination based on the IGRF
and DGRF models, covering a range of
date from 1900 to 2005. This allows you
to enter accurate declination for any
location and any modern date. The
Project Manager also has a feature that
overrides the entered declinations and
calculates them for each survey during
the compile and closing process. |
 |
|
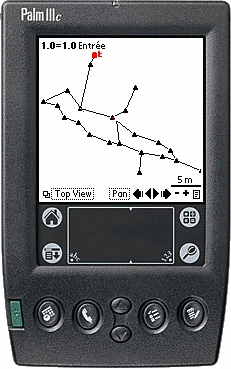
Palm Computer Support. Auriga
is a program that allows you to enter and plot
cave data directly into a Palm computer. Since
Palm computers are small, light and
inexpensive, they can be carried underground and
are the perfect surveying tools. Auriga now has
features that allow you export the cave data to
Compass. For more information, follow this link:
http://www.speleo.qc.ca/auriga |
 |
|
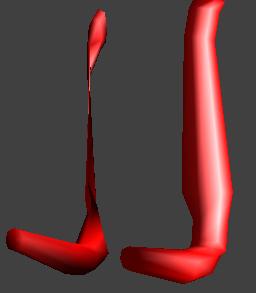
| CaveX
Passage Modeling. CaveX now has
improved passage modeling. Passage
corners are now smoother and transitions
more accurate. Vertical passage are now
handled so the LRUDs are converted to
West, East, North and South, when the
passage inclination exceeds a certain
threshold. The image to the right show
the difference. The first image shows a
pit with LRUDs treated normally. The
second image show the LRUDs treated as
West, East, North and South. |
 |
|
|
Shapefile Export. Compass now can to
do direct exports of Shapefiles, which
allow cave data to be read into ArcView
and other ESRI programs. The export
includes nine different parameters so
that different aspect of the cave
passages can be viewed separately in the
GIS programs. The options include 2D and
3D passage modeling. (To the right you
will see transparent 3D passage models
in ArcView 3D Analyst.) Having
Shapefile export in Compass allows you
to use free ERSI software such
ArcExplorer. For more information on
using Compass with ESRI software,
click here. |
 |
|
| CaveBase.
CaveBase has been convert to a 32-bit
program. It has an improved windows
layout, making it easier to view and
edit the data. There is improved support
for Access
databases. The latest version of the
Borland Database Engine is now
distributed with Compass. |
All Programs. The use
of Windows resources by all Compass
programs has been reduced by 80%. This
is especially useful for people who are
using Windows 95, 98 or ME because these
operating systems don't allocate
resources very efficiently. This makes
Compass more stable under these
operating systems. Also means that you
can open up to four copies of the Viewer
without depleting resources under Win98.
(Note: this was never an issue under
WinNT, 2000 or XP.) |
|
|
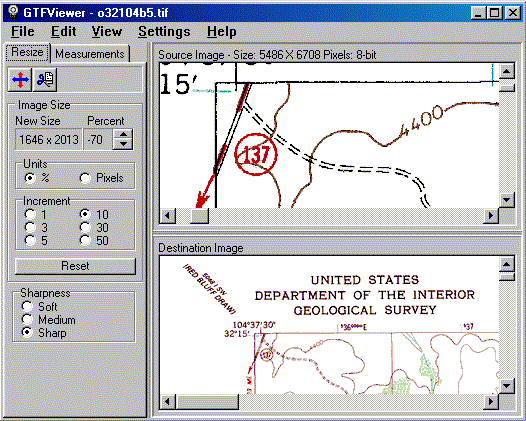
THE GTFVIEWER. The GTFViewer is a new programs that allows you to
view, manipulate and load "GeoTiff" images into COMPASS. GeoTiff files are
produced by the USGS and other government agencies and they generally contain
topo maps and aerial photographs. The program has many features:
|
|
 |
|
LARGE IMAGES. GeoTiff files can be very large and Windows 95/98/Me
has trouble handling large bitmap images. This leads to memory errors even
when the computer has plenty of memory. The GTFViewer uses special routines
to minimize the effects of these problems. Under Win NT, 2000 and XP, the
GTFViewer can deal with images of any size with absolutely no problems.
|
|
TRIMMING IMAGES. The GTFViewer allows you to trim off parts of the
image to get rid of borders and to zero in on specific parts of a map or
aerial photograph. This also reduces the size of the file, which can make
it more useful for publication or display on the web.
RESIZING. GeoTiff files are often very large, which makes them difficult
to handle or view on normal computer screen. The GTFViewer can rescale an
image to any size. The program uses special resizing algorithms, which minimize
artifacts and loss of resolution. |
|
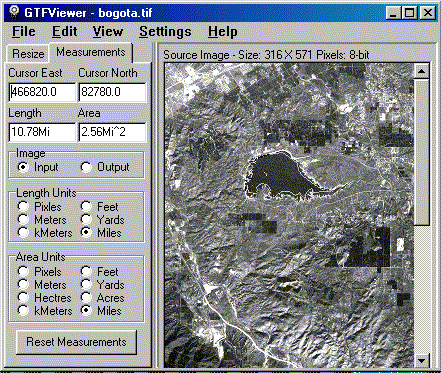
| MEASURING. Many GeoTiff files contain scale and location
information. As a result, the GTFViewer can measure distances and surface
area on maps and aerial photographs. Distances can be measured along curving
features such as roads, streams, etc. Area can be measured for irregular
shapes such as lakes, cities, etc.
|
Example. In the example to the above, we are measuring the perimeter
and area of reservoir near Bogota, Columbia. As you can see, the perimeter
is 10.7 miles and the area is 2.5 square miles.
PRINTING. The GTFViewer has special features help you deal with printing
large images. The images can be shrunk to fit the size of the paper. It also
capable of printing full resolution images tiled across multiple sheets of
paper. |
THE COMPASS VIEWER.
The Viewer now has an animation option
that makes it much easier to create smooth
animations. To create an animation, you just
select a few view-points that move through
the parts of the cave you want to view. The
program then produces a smooth animation
through all the points. You can even include
a complex series twists, turns and zooms,
and the program will smoothly animate all
movements simultaneously. |
|
VIEWER. The Viewer can now export the Rose Diagrams and the Depth
histograms as Windows Metafiles. This produces much higher quality images
in word processor and publishing programs.
VIEWER. The Viewer now has a features that helps draw passage models
for vertical or near-vertical passages. When the feature is turned on, the
program substitutes west, east, north and south for Left, Right, Up and Down
respectively. This gives more realistic models for steep passages. You also
have the choice of selecting a threshold angle at which the vertical modeling
takes place.
PROJECT MANAGER. The program now has the ability to display a chart
of all the station name sequences that have been used in the survey. This
makes it easy to find what station names have been used and what names are
currently free. Thanks to Peter Bosted for the idea and the basic algorithm
for accomplishing it.
CAVEX AND XWEB. Microsoft has discovered a security problem with the
XWeb control and Internet Explorer. The COMPASS web page now has information
about resolving this problem.
GENERAL IMPROVEMENTS. There are also a number of minor improvements
including improved support for different video resolutions, more information
saved with the "Views" feature, a CMAP file import feature, an option for
omitting directory information from exported SEF files, support for 10-meter
DEM files, improved statistics display, example inventory database included
and the CaveBase screen can be expand to full size.
BUG FIXES. I have fixed various bugs including problems with very
long pathnames, problems with large bitmap images under Win95/98/Me, problems
with icons, problems with Metafiles, inter-cave closure problems, and
fixed-station closure problems.
-
CREDIT CARD REGISTRATION AND ORDERING. You can now register and order
COMPASS packages through secure, online credit card transactions.
 Click here for more
information. Click here for more
information.
-
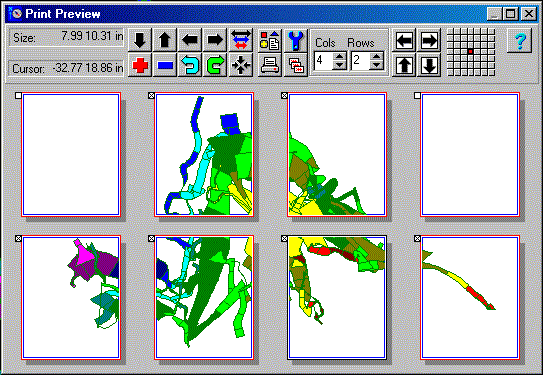
VIEWER. Viewer now has the ability to display multiple pages on the
Print Preview window. You can also print all selected pages in one operation.
This is useful when you are printing caves at a scale that will take up more
than one page. The preview will display up to 100 pages simultaneously, with
each page placed in a grid so you see how the cave will be positioned
on each page. These are perfectly scaled pages that show an exact model of
the what will appear on the page, including variation in paper size, orientation,
rotation, colors, labels and passage wall modeling. You can micro-adjust
the position on the pages.
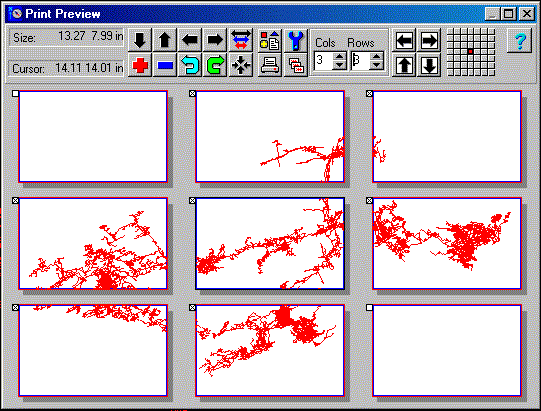 |
| This image shows the Print Preview screen with nine pages displayed.
Here the
printer is set to Landscape Mode with 8.5 x 14 paper so the pages are scaled
so
they match the paper size. The "Cols/Rows" display controls the number of
pages
that will be displayed. The checkboxes in the upper left-hand corner of each
page
controls which pages will be printed. Here, the two blank pages will not
be printed. |
|
|
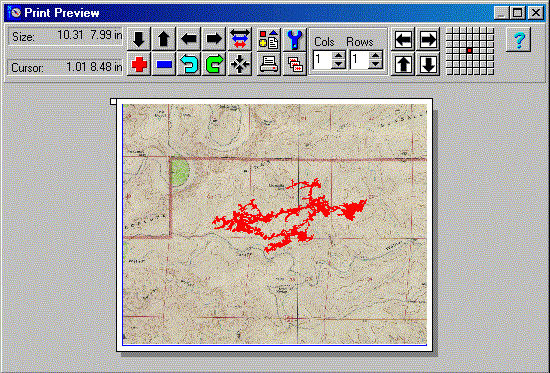
| This image shows how the Preview Screen can even display complex
color plots
and bitmap bitmap background images. In other words, with the Preview Screen,
what you see is truly what will be printed. |
The Printing routines have been rewritten to improve their reliability and
performance. For example, some large format printer and plotters have defective
drivers that cause problems if you try to print on paper larger than 32 inches
in any dimension. The Viewer now has an option that compensates for this
problem by lowering print resolution. Also, the print routines have been
rewritten so they more faithfully reproduce bitmap colors. Finally, the pan,
zoom and rotate buttons in the Print Preview dialog will "auto-repeat" if
hold you them down for a half second. This makes it much easier to position
the cave on paper.
 |
This image shows one of the color passage modeling modes printed
across several
pages. Here, the printer is in Portrait Mode, with 8.5 x 11 inch
paper. |
-
PROJECT MANAGER. There are several improvements to the Project Manager
display. The "Project Tree" displays a specialized icon for each type of
data in the project. Also, data files that have Links or Fixed Stations
associated with them show a "book" style icon instead of a folder. All operations
associated with the "Survey Tree" have been drastically speeded up. This
is very useful when you are working with caves large numbers of surveys.
"Drag-and-drop" operations have been improved so the are more intuitive.
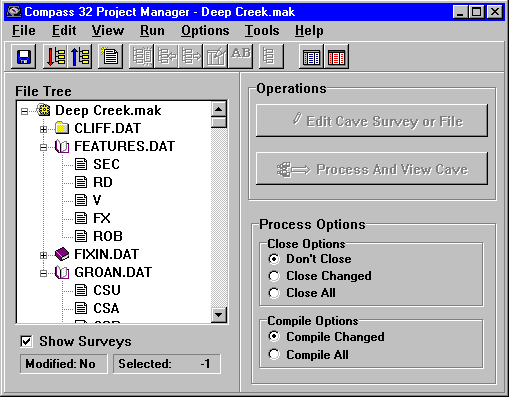 |
| Here you see a multi-cave project showing several caves and
surveys. The
brown-colored "books" are associated with surveys that have links or fixedstations connecting them to other caves or geographic references. |
-
VIEWER. The Viewer has a large number of general improvements. For
example, the "Exclude Extents" option of the Complex Plotting feature now
allows you to zoom in on the Windows. This makes it easy to visually set
more precise clipping boundries. In addition, the pen thickness option in
the Printer Options Window, now applies to station marks. This makes the
marks easier to see on a high resolution printers. You also have the option
of removing the dotted line crossbars that appear in the passage modeling
when mark stations. Finally, The station marks are now scaled in Points instead
of Pixels so their size is more consistant across printers and video
displays.
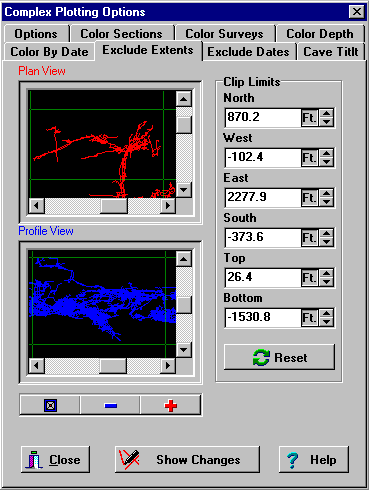 |
| This window shows the new clipping window. You can
now zoom in on the cave using the "Plus" and "Minus"
buttons. You can also pan using the scroll bars. This
way, you focus excluding and including specific parts
of the cave. |
-
EDITOR. I have fixed several problems that, under certain conditions
could cause problems saving newly modified cave data. These included files
set to be "Read Only" and problems with the Delete Key under Windows 2000.
-
DEM Reader. The DEM Reader will now copy data from the Edit Grid to
the Windows Clipboard. This can be useful for putting terrain data into
spreadsheets and other programs. The DEMReader will also save users default
such meters/feet and all the plot options.
-
Project Manager. The compiler now converts negative shot lengths to
positive for the purpose of totaling cave lengths. (Apparently, there is
old data that contains negative shot lengths.)
-
General. The Section Name is based on the name of each data file.
As a result, the size of the Section Name has been increased to 20 characters
to make it more compatable with long filenames.
-
32-BITS. All the main COMPASS programs have been converted to 32-bits.
This makes the programs between 3 to 20 times faster. It also means that
there is complete support for long filenames.
-
INTEGRATED WITH WINDOWS. COMPASS is now completely integrated into
the Windows shell including the ability to create new survey files and project
files from the Windows context menus.
-
NEW INSTALLATION PROGRAMS. All COMPASS program have new and more
professional installation programs which automatically handle integration
with the operating system, including the ability to double-click on files
to process and view them.
-
NEW HELP FILES. Over the years, the COMPASS help files have grown
haphardly as new feature were added. As a result, they were disorganized
and there were many typos and spelling errors. All the main COMPASS help
files have been completely rewritten and reorganized, with many more hyperlinks
and more information. There are now more than 480 pages of help in the main
COMPASS help documents.
-
SPEED. The Viewer is now 20 times faster than the previous 16-bit
versions. This means that even the largest caves can be animated for movie-like
zooms, pans and fly-throughs. Currently, on 450 Mhz PIII, the Viewer is capable
of displaying all 106 miles of Lechuguilla Cave at 20 frames per second.
The refresh rate is even faster as you zoom in.
-
METAFILES AND ENHANCED METAFILES. The Viewer now supports exporting
Windows Metafiles. Metafiles have advantages over bitmaps because they can
be resized without losing pixels or creating jagged lines. The Viewer can
export both Regular and Enhanced metafiles. This makes it compatable with
many different drawing and CAD programs that can import metafiles. Enhanced
Metafiles produce very high quality printouts that are much better suited
for publication.
-
AVI MOVIE FILES. The Viewer will now save cave movies as Windows AVI
files. This allows them to be displayed on any movie viewer and they can
also be converted to other formats like MP3 for display on the web.
-
AUTOMATIC MOVIE CAPTURE. The Viewer now has a special features that
automatically captures movie frames each time the image changes. This allows
you to capture movies on-the-fly as you pan and zoom through the cave. This
makes it easy to create realistic movies.
|
 |
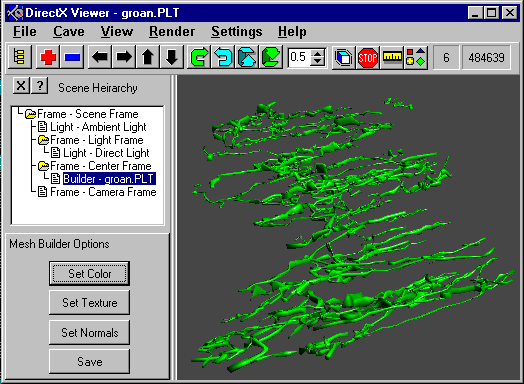
Groaning Cave. Showing passage model
modes including spline curves, colored fill
and enclosed passages. |
|
-
INTEGRATED COMPILER/LOOP CLOSER . The Loop Closer and Compiler have
been integrated into the Project Manager. This makes COMPASS easier
to use, easier to set options and gives better access to statistics and blunder
location tools.
-
BLUNDERS AND STATISTICS. Statistics and Blunder Finding options have
been vastly improved. Both Compile and Close statistics have been integrated
into Project Manager. Paging has been eliminated and all statistics are displayed
on a single screen. The statistic window can be expanded to full screen,
for easier viewing. The Blunder detecting routines have many improvements.
These include the ability to step through the blunders from worst to best,
which allows you to focus on the worst blunders first. Also, the "Tie-In"
option now displays the "from" station to more clearly deliniate which shot
is adjusted. Finally, more detailed information can be copied to the clipboard,
printed and saved along with the summary of blunder analysis information.
There are also eight new statistical items.
-
BREAKING LOOPS. The Compiler now allows you to break loops at the
closing shot. This allows you to visually see the effect of loop errors and
find possible bad tie-ins.
 |
| COMPASS Viewer. Showing Surface Modeling and Complex
Color-by-Section features.
The surface terrain is in red and six separate caves in different colors. |
-
CAVEX AVI FILES. CaveX now has the option of saving AVI movie files
of your the 3D cave models. When you turn on the AVI mode, all movements
and changes are saved to the movie. This means that you can fly through and
around the cave and everything you see will be saved in the movie. You have
complete control over the frame rate and you can set movie capture to stop
after a certain number of frames or a certain time.
-
DEM FILES. The USGS has turned all its data distributions over to
a private company. The data is still available free and they have more complete
coverage. However, the data is more difficult to find and download.
Click here for links.
-
DEM READER. There are many changes to the DEM Reader. You can
now paste grid points into the DEM reader from the clipboard. This allows
you to import elevation data from spreadsheets and databases.You can also
export the grid data as standard survey DAT file. This gives another, more
flexible mechanism for creating a surface grid.
-
DEM READER. More and more DEM files are being distributed with file
format defects. This usually renders the files unusable. However the COMPASS
DEM reader will handle five different DEM file defects. This will allow you
to use many DEM files that would normally cause errors. DEMReader will handle
the following flaws. 1) Missing map-corner information. 2) Descrepancies
between map corner locations and profile locations. 3) Modulo 1024 byte blocks
terminated with CR/LFs. 4) Modulo 1024 byte blocks terminated early with
LFs.
-
CaveX is vastly improved. It will now how handle caves of unlimited
length. It takes better advantage of accelerated video cards so it can animate
caves as much 10 times faster. It is more tolerant of different video cards
and system configurations. Current performance is such that on a 450MHz Pentium
III, it can do a fully realistic, animated, 3D passage models of all 106
miles of Lechuguilla Cave at 20 frames per second. Even with Gourad shading,
perspective transform, hidden line/face removal, texturing, multiple light
sources, specular highlighting and various other special effects, the program
achieves speeds of over 2 million polygons per second.
 |
| View of Lechuguilla Cave. The Labarge Borehole area is
in the foreground, the Tinseltown Maze is in the upper right,
Voids are to left and the purple passages on the left is the
Deep Maze. |
|
CaveX has several new features that help orient the cave. It will now
displays a "bounding box" that makes it easy to see the orientation of the
passages. It also now supports the same color-by-depth options as the regular
Viewer including individually colorable bands, individually adjustable band
thickness and gradient colors. All images can be copied to the Windows clipboard
for display in other programs.
To help you control your joystick fly-throughs, CaveX has a new "Look At"
button that causes the viewer to smoothly pan and rotate until it is looking
directly at the center of the cave. It also rotates the image so the top
of the cave is aligned with the top of the screen. This is useful when you
have panned, zoomed or flown to a position where you can't find the cave.
Since it does not change the scaling or move the camera closer to the cave,
other information information is not lost. Also, there is a button on the
Joystick which does the same thing. |
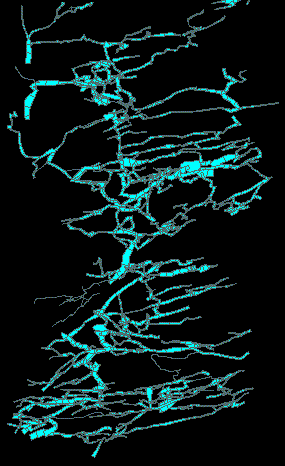
|
Image of Lechuguilla Cave showing UTM grids lines.
|
 |
|
Viewer. The Viewer now has several new Shadow Box features. Grids
can be added to the walls of the shadow boxes. You have complete control
over which walls are gridded, the color and style of lines, and the spacing
or count of the grid lines. The walls can be filled with color for better
visual contrast.
|
 |
|
Finally, you can remove the Shadow Box walls and just display the grid. This
is very useful for things like putting UTM grid lines on the
map. |
-
Viewer. There is a new 32 bit version of the Viewer that is now available
for beta test. It is 10 times faster than the regular 16 bit version. This
gives it enough speed to fully animate even the largest cave. On my 450 MHz
Pentium III, I'm getting drawing rates of 15 frames per second for large
caves like Lechuguilla.
-
Editor. The Editor now has the option of setting flags for multiple
blocks of surveys simultaneously. You have the option of Inserting, Replacing
or Removing specific survey flags. The Repair option now allows you to work
with fore and backsight values separately. This makes it possible to repair
large blocks of data where only the foresight or the backsight is bad.
-
All Programs. COMPASS now gives you the choice of using the International
Foot or the US Survey Foot when displaying or converting data. While the
International Foot is used for most measurements, the US Survey Foot is still
widely used for maps, surveys, benchmarks and government projects. Using
the incorrect units can make big difference when converting large numbers.
For example, it can make as much as a 35 feet in difference when converting
UTM coordinates.
-
General Improvements. There are five new statistical measuresments
including, Surface Length, Surface Width, Surface Area, Enclosed Volume,
and Volume Density. The Viewer has a simplier, more user- friendly method
of setting all the different color and font options. The DXF export option
now allows you to pre-scale the exported image for those drawing programs
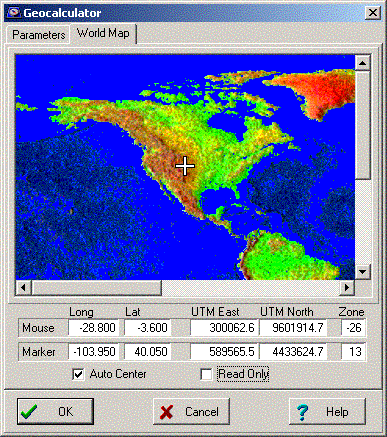
that have limited scaling capabilites. The Geographic Calculator is easier
to use and COMPASS now supports using the UTM "Convergence" angle for rotating
the cave to match the UTM grid. In addition to scale, vertical magnification,
you can now set exact values for pitch and yawl rotations. The survey header
comments had been increased to 80 characters. The functions of the project
manager has been improved. The Passage Model Dialog now has a "View" button
that allows you to see any changes before exiting.
-
Digital Survey Map Tutorial. I have posted a tutorial by Paul Burger
on generating salon quality survey maps using a drawing program. See the
current issue of Compass and Tape (#48) for some examples of Paul's maps.
Click here too see the tutorial.
-
The COMPASS CD. The CD now has many more items including more DEMs
and the Microsoft DirectX-7 installation package. The CD now contains
376 files and 52 folders for a total of more than 170 megabytes of
programs, files and data.
-
Web Page. There are new links to DEM files, with more complete coverage
of the United States. The cost for downloading 7.5 degree version DEM is
only $5.00. Click here for links to all the DEM download
sites.
-
There are dozens of other new features, bug fixes, and minor
improvements. Click here for a complete list.
-
COMPASS USERS WEB PAGE. Click here to see
the caves and images that other COMPASS users are displaying on the
net.
-
COMPASS CD-ROM. The complete COMPASS software package and
accessories are now available on CD-ROM. It contains all software and
documentation plus other materials too large to post on the internet or put
on floppy disk. Currently, there are 45 programs and 300 files totaling more
than 60 megabytes of data. Even if all this information were on the internet,
it would require more than 3 hours to download on a 56K modem. The
COMPASS CD is ideal for cavers who are traveling because CDs are more
durable than floppy disks and less suseptable to damage from magnetic fields,
airport X-Ray machines etc. Click here for more
information.
-
Quad Map Settings. The Viewer now saves all the Quad Map settings
with the "Views" information. This means that you can set up any number of
quad map patterns and save them for later recall.
-
SEF IMPORT AND EXPORT. In the past, you had to use a DOS program to
import or export COMPASS files. The Project Manager now supports import and
export to SEF file.
-
ACCURACY. Several changes have been made to improve the accuracy and
resolution of all COMPASS programs. First, COMPASS now supports
24 geodetic formats for geographic coordinates like longitude, latitude,
and UTM. In addition, data is now stored with more digits of accuracy, giving
at least 1.5 mm or 0.06 inch resolution. Finally, I have cleared up a descrepancy
between the the "International Foot" and the "US Survey Foot" which caused
small errors with some UTM measurements.
-
NEW STATISTICS. COMPASS now reports a variety of new statical information
about the cave. The Compiler now caculated the cave volume based on passage
diameter and shot length. It also calculates thes Average Passage Diameter.
This is a measure of the size of the passage in the cave. Another statistic
that is now available is Average Inclination. This gives a general estimate
of how vertical the cave is. The final statistic in this group is Difficulty.
It combines the Average Passage Diameter and Inclination to give an estimate
of difficult it is to move through the cave.
-
In addition to this set of statistics, the Compiler now list the overall
average STD for all the loops in the cave. This gives you a single number
that rates the overall quality of all the loops in the cave. Finally, the
Compiler includes a set of Survey Specific statistics. This includes a list
of each survey in the cave along with the length, number of shots and average
shot length for each survey. To facilitate working with larger systems, the
Compiler now allows you to search for any string in the Statistics and Blunder
Detection section. This makes it easier to find loops, stations, shots, and
surveys in the statistics.
-
CAVEBASE. The Viewer now supports displaying database values as numerical
values as well as varying symbol sizes. Numbers can be in fixed or scientific
notation format, with complete control over the number of digits. CaveBase
now has an option that allows you to encode a date as a part of the query.
-
DXF EXPORT. There are now DXF export features that allows more parts
of the drawing to be exported as separate layers. You can now associate the
Passage Wall modeling and the Station Labels with each Survey layer. This
enables you to isolate specific parts of the cave for DXF export.
-
SPREADSHEET IMPORT AND EXPORT. The Editor now uses Tabs as the delimiter
when it Copys, Cuts, or Pastes to and from the Windows Clipboard. This makes
it more compatable with external Windows programs like Excel.
 |
|
Image From The Current Version of The COMPASS Viewer |
-
USABILITY FEATURES. The Editor allows you to search through a survey
file for the surveys where a specific station is found. You can now double
click on any of the surveys that are found and the program will automatically
highlight the specific survey. This makes it easy to find and edit that survey.
In addition, a new option has been added that puts the highlight on the From
Station whenever a new shot is created. This makes it easy to override the
Automatic Station Sequencing feature and enter a different Station Name.
-
MISCELLANEOUS. The Survey Name fields has been increased from 8 to
12 characters. The Viewer now allows you to mark the passage walls from the
orientation of the TO station.
-
LIVE INTERNET 3D IMAGES. COMPASS can now produce 3D images of caves
that can be viewed and manipulated live on the internet. These are full 3D
passage models that are lighted, smoothed, shaded and textured with photographs
of limestone. The images can be zoomed, panned and rotated live on the internet.
I'm getting refresh rates of 60 frames per second on a 400 Mhz Pentium. Posting
these images is simple and there are complete instructions on the web page
showing you how to post your own images. The web address is:
Viewing Cave Images On The Internet
-
CAVEX. There are many changes to CaveX including improved rending
and editing features. The scene diagram is easier to access. The program
can now render the cave image in profile mode. This makes the cave images
more compatable with standard 3D editing programs. It is now easy to save
images and textures to DirectX files. Internal textures can be saved with
the X files.
-
COMPASS USERS GROUP AND MAILING LIST. Roger Schuster is starting a
COMPASS Users Group and Mailing List. Roger is also the sponsor the
German COMPASS mirror web page. The purpose of the mailing list is
to help people solve COMPASS problems and provide an avenue for users
to give feedback. It is also to exchange experiences, tips and hints between
users. For more information, goto:
..\Users\compassusers.htm
-
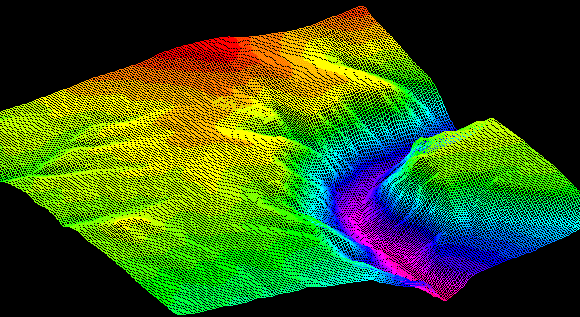
New 24 Colors. There is now a new feature that allows the Viewer
to use a rainbow spectrum of 24 colors for coloring by depth, date etc. The
colors are arranged in a smoother spectrum than original 12 colors. This
makes it easier to visualize subtle details. Here is a terrain model showing
the 24 color mode:
-
32 Bit DEM Reader. The DEM reader has been completely rewritten using
32 bit code. This allows you view and edit DEM files at twice the resolutions
as before. It also means that DEM Reader is a 32 bit program and will not
run under Win3.1. If anyone is still using Win3.1, send me email and I can
post the old version.
-
Cross-File Loop Closing. The Loop Closer can now close loops that
cross multiple files. This enables you to close large cave systems while
still maintaining the data is smaller more manageable files.
-
28. NEW WEB PAGE. ESRI, the makers of ArcView and ArcInfo have a new
cave related web page. The address is:
http://www.esri.com/industries/cavekarst/index.html
-
Viewer. There have several improvements and bug fixes in the the Rose
and Depth graphs. In the past, vertical shots were included in Azimuth Rose
diagrams. This created an inordinate number of 90 degree shots. You now have
more precise control over the band thickness.
-
Project Manager. The Project Manager now a has feature that allows
you to make copies of the files in a projects and put the copies in other
directories, drives or floppy disks. This make it easy make copies of the
project and share your data with other people.
-
All Programs. The various search features of the Editor, Project Manager,
and Viewer have been improved so they are less picky about how the targets
are matched. This means that it is easier to find partial matches.
-
Viewer. The "Find Stations/Surveys" tool now operates so that all
parts are synchronized. This means that when you locate a station, the
corresponding survey and sections are shown. This makes it easy to find which
stations, surveys and file belong together.
-
Viewer. The Viewer now has the ability to select a survey or section
of the cave and go directly to the Editor to view or edit the selected survey.
Thus, you can highlight a survey and go directly to the raw data for that
survey.
-
Loop Closer. The Loop Closer has improved capabilities in dealing
with fixed stations. Several problems were fixed where certain combinations
of fixed stations caused incorrect closure.
-
The Editor can now validate backsights for all the surveys in a file as well
as a single survey. This makes it easier to find backsight problems in large
survey files.
-
There are lots of other minor improvements and bug fixes for the Editor,
Viewer, Project Manager and file conversion utilies.
-
ROSE DIAGRAMS AND DEPTH HISTOGRAMS. COMPASS now has extensive support
for graphing "Rose" Diagrams and Depth Histograms. Click
here for actual images of the kinds of graphs COMPASS can produce.
-
MODULO DEPTHBAR TICK. The Viewer now supports modulo depth bar ticks.
This means that the depth bar ticks can be placed so that they occur at even
intervals like 10, 20, 30, or 25, 50, 100, etc.
-
JOYSTICK CONTROL. CaveX now support the use of standard PC joystick.
This allows you to do full motion, 3D flying around and through fully textured
cave passages.
-
IMPROVED DXF EXPORT SUPPORT. The Viewer has improvements to the DXF
exporting feature including a "scale bar" and "north Arrow", profile mode
export, more control over "layers", and a "Tick Marks" options for the LRUDS.
Many of these features are useful for drawing programs that don't support
the full 3D drawing modes of AutoCad.
-
MISC. In addition there are more twenty other minor improvements and
bug fixes including simplier "Views" editing and saving, more "block-modify"
features for the editor, improved statistics and several improvements to
CaveBase, the database system.
-
AUTOCAD DXF EXPORT. The Viewer now has the ability export DXF files
compatabile with AutoCad versions 12, 13 and 14. Click
here for more information and a snapshot of the Export Control.
-
HIGHSPEED FLYTHROUGHS. CaveX the DirectX cave viewer has many
improvements. There are new pan, zoom and rotate buttons and the ability
to finely control their increments. CaveX also has the ability to fly around
and through the cave image using simple mouse movements. I am currently getting
solid modeling speeds of 20 frames per second and 2 million polygons per
second on 20 mile long caves, with Gouraud shading and limestone photo texturing.
This give you the ability to do game-like "flying" in and around the cave.
-
AUTOMATIC LIMESTONE TEXTURING. CaveX also has a one step texturing
proceedure that simplifies the process of creating smooth-textured passage
walls. It also has a built-in limestone texture that gives a rock-like appearance
to the passages.
-
SAVING MOVIES AND SLIDESHOWS. The Viewer now has the ability to save
movie files to disk. This allows you to create movies and slide shows of
various caves and save them for later viewing or showing. There is also much
more extensive support for editing the movie frames.
-
MORE REALTIME FEATURES. The Viewer also has several new features that
allow better control of the "realtime" "flythroughs" of the cave. This is
all done with simple mouse movements The program also now supports "live"
tracking of the 3D Compass to give even smoother and more realistic rotations.
-
COMPILER IMPROVEMENTS. The Compiler can now save a set of default
settings. This means that you can set the Compiler to run with a specific
set of value each time it runs, without manually setting the options. Also,
the Compiler now allows you to print the list of errors that appears in the
error log.
-
NEW ARTICLE ON LOOP CLOSURE. There have been lots of questions about
the way COMPASS closes loops. This led to a series of articles that appeared
in the NSS publication Compass and Tape. I have published an updated version
of the last artilce on the web page for people who don't receive Compass
and Tape.Click here to view the article. The articles
also led to an exciting new project by John Halleck where he is working an
a detailed tutorial on the proper way to do least squares loop closure. His
web page is at:
http://www.cc.utah.edu/~nahaj/cave/survey/
-
VERTICAL MAGNIFICATION. The Viewer now has the ability to vertically
magnify the plot. With vertical magnification, the vertical aspect of the
plot is magnified while the other dimensions remain the same.
Click here for a visual demonstration of this feature.
-
DIRECTX VIEWER FOR STUNNINGLY REALISTIC PASSAGE MODELS. There is now
a special new COMPASS program for creating extremely realistic passage models.
The program creates very smooth, fully three-dimensional passages that can
be animated in realtime. For more information click
here.
-
PASSAGE MORPHOLOGY HIGHLIGHTING. The Viewer now has the ability to
color cave passages according to the size and shape of the passage. The program
analyzes the height, width, and cross sectional area and can color passages
that fit into different categories. For more information
click here.
-
IMPROVED EDITOR SCREENS FOR HIGHER RESOLUTION DISPLAYS.
-
The Cave Editor has been improved so that it takes advantage of the higher
resolution displays and larger monitors. The program allows the window to
expand to full size and the various editing screens expand with it. In other
words more rows and columns from the survey are visible on the screen. This
means, for example, on a 1024 by 768 resolution display, 20 lines of survey
and all columns are visible without scrolling.
-
MERGING DEM FILES. The DEM reader can now merge adjacent DEM files.
This is useful when the area you are working with is near the edge of a DEM
files. It allows you to center your terrain models on any location. Files
can be merged east-west or north-south. A pan factor setting allows you to
center your merged file location between the two files. You can also center
on corners by first merging east-west files, then north-south.
-
REMEMBERING THE LAST FIVE FILES. All COMPASS programs now save the
last five files you used in the file menu. This makes it easy to open recently
used files.
-
IMPROVED BITMAP COLOR RENDERING.
-
Improved the color rendering of the background bitmap images. This results
in more accurate color rendering of topographic maps as backgrounds to the
line plots.
-
DEM Reader. The DEM Reader has been completely rewritten. The elevation
editor has been improved to make it easy to enter, save and link elevation
data manually. In addition, the program can now perform the complete operation
of linking caves and surface features under Windows. In the past, you had
to use the DOS program FCOMPILE. You also have the option of displaying contours,
grids and a combination of contours and grids.
-
The USGS has been converting all its DEM data to a new data format called
SDTS. As a result of this process, there are now a large number of 7.5 minute
DEM quadrangles available FREE on the net! The COMPASS DEM Reader now has
support for converting and reading SDTS format files.
-
Click Here For Terrain Modeling Images
-
Click Here For Information On Using 7.5 Minute SDTS
DEMs with COMPASS.
-
Locking Plots To The Page. There is now an option that allows you
to force a station to be placed at a certain location on the print out page.
This allows you to lock the cave plot to a particular position on paper.
This is useful for producing quads, atlases and historical maps.
-
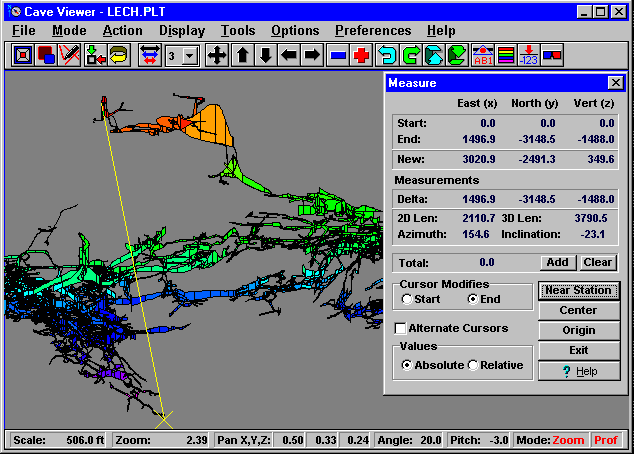
Passage Length Measurements. The Measure Cursor now have two features
that allow you to measure the passage distance between any two station in
the cave. First, you know have the option to make the Measurement Cursors
alternate with each mouse click. This makes it easy to walk the cursor along
a passage. Second, you can sum the lengths of each measurement. This allows
you walk the cursors down a series of passages, summing all the measurements.
-
Centering On A Station/Survey. In addition to highlighting surveys
and station, you can also have the program center the display on a survey
or on a single station. This is useful for zeroing in on sections of a complex
cave. It is also useful for centering rotations around specific point in
the cave.
-
New Technique For Exporting COMPASS Files To CAD Programs. Steve
Reames has developed a new technique for exporting COMPASS plots into CAD
and Drawing Programs such as Corel Draw. The techique is capable of exporting
complete COMPASS maps including legends, labels, passage walls, quad-grids
etc.For A Complete Description of the Technique, Click
Here.
-
Viewer. The Viewer now has a special option that allows you to display
a "Shadow Box" around the cave. With the Shadow Box options, the program
draws a box around the cave and mirrors the cave on the walls of the box.
The option makes it easier to see 3D aspects of the cave. The program gives
lots of options for controlling which walls are mirrored and the placement
of the walls. Click Here To View Shadow Box Images
-
Viewer. The Viewer can now save bitmap images of the screen at high
resolutions up to 600 dot per inch. This is useful when you are publishing
cave images. High resolution images give smooth lines and images on a printed
page.
-
Viewer. The Viewer can save all the settings that go with a particular
view of a cave. These settings are called "Views." Views can be saved and
restored. Dozens of views can be saved to a file. This means that even the
most complicated settings can be restored with a few mouse clicks. This makes
it easy to do presentations and work on special projects.
-
Viewer. Up until now, all the passage modeling modes displayed 2D
images of the passages. This was necessary for the spline curve modeling
and it also allowed the images to display faster. Passage modeling now has
a mode that displays full 3D polygons of the cave passages. It also creates
more accurate display when doing 3D rotations. You also have the choice of
displaying the passage outlines as diamond or rectangular shapes.
Click Here To View The New 3D Modeling Modes
-
Viewer. You can now display stereo views of the passage wall modeling.
This allows you to see the dimensions of rooms and passages in 3D.
-
Viewer. In the past, the Viewer would place passage wall marks at
both the From and To stations. Since most stations are both a From and To
station, this puts two sets of markers at each station. The new feature gives
you the option of putting only one set of markers at each station. This makes
the markings less confusing and easier to use for map drawing.
-
Project Manager. You can now enter fixed station location in either
longitude/latitude or UTM. Long/Lat can be entered in either decimal degrees
or degrees, minutes, seconds. The program allows you convert easily between
the two units.
-
ALL. All Windows COMPASS programs now support 12 character station
names. The only reason they are not larger than 12 characters is to try to
maintain a minimum amount of compatability with DOS version. Because of the
limitation of DOS memory, the DOS version will not be able to move much beyond
8 characters.
-
Viewer. There is now an option that moves the Measurement Cursors
to the nearest survey station. This makes it easy measure 3D distances between
stations.
-
The Viewer nows shows the comments and date associated with each survey.
This information is displayed in the Find Survey dialog box. Comments can
also be searched for any partially matching string. View
New Find Survey Dialog Box
-
Viewer. The Viewer can now display the angle of cave rotation in three
ways. The first shows the number of degrees the cave has been rotated. The
second shows the angle you are looking toward as the cave is viewed and the
third shows the angle the cave is viewed from.
-
View/CaveBase. The Viewer and CaveBase can now display the query results
by coloring shot nearest the station. This is useful when the marking with
a symbol would create a crowded and cluttered display
New Database Line Marking Features
-
Project Manager. The Project Manager has a new "Project Creation Wizard"
that guides you through all the steps of creating a new cave project.
-
Complete Set Of COMPASS Screen Images
|