|
COMPASS For
Windows |
|
|
|
Getting COMPASS
|
|
|
|
Download/Install Issues
|
|
|
|
Registration
Information |
|
|
|
Auxiliary Tools/Information |
|
|
|
Tutorials - (New) |
|
|
| Links |
|
|
|
Documents/White Papers |
|
|
|
COMPASS For DOS |
|
|
|
MISC. |
|
|
|
|
|
|
|
|
What is COMPASS? |
|
COMPASS is a cave mapping software package designed to edit,
process, analyze and view cave survey data using any
Windows-based computer. The programs in the system allow
you to enter cave data, revise the data, generate
statistics on the cave, close loops, view plots from any
angle and finally, print finished quality plots on
almost any printer or plotter.
COMPASS has hundreds of powerful features, including a configurable
survey editor, high speed real-time 3D passage wall modeling, GIS and
data base compatibility, sophisticated loop closure and blunder
detection. COMPASS is extremely fast capable of animating of
caves in excess of 150 miles in length. It is also very easy to use,
with built-in wizards and tools that make it easy for novice users to
manage and work with large cave systems. COMPASS
will run on any modern version of Windows from Windows XP to
Windows-10. COMPASS
is constantly being refined to add new features and take advantage of the
latest technologies.
For a complete description of all the Compass features, checkout the
Compass Tour. |
 |
|
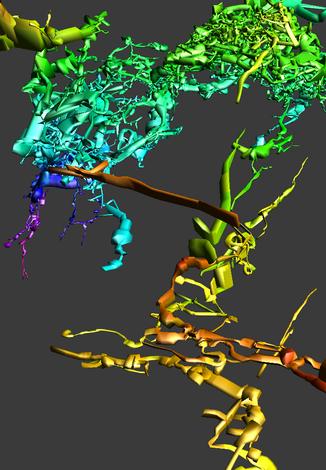
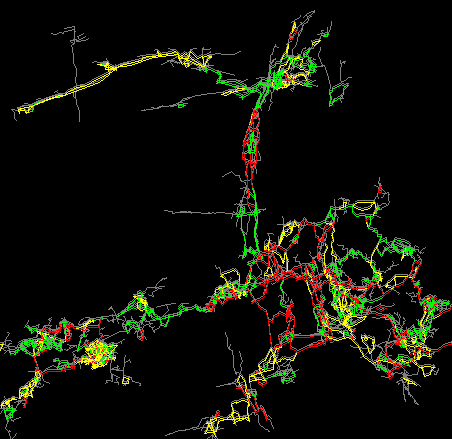
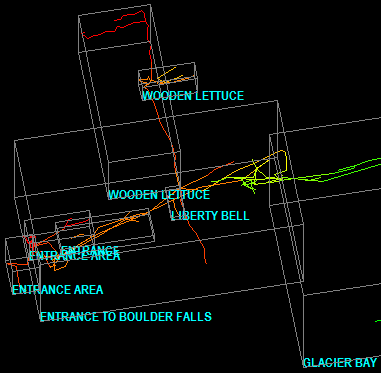
3D,
Depth-Colored Model of Lechuguilla Cave |
| The Labarge
Borehole area is in the foreground, the Tinsel-Town Maze
is in the upper right, The
Voids are to left and the purple passages on the left is the
Deep Maze. |
|
|
|
Latest Revisions and Features. |
|
Update - 2-9-24 |
|
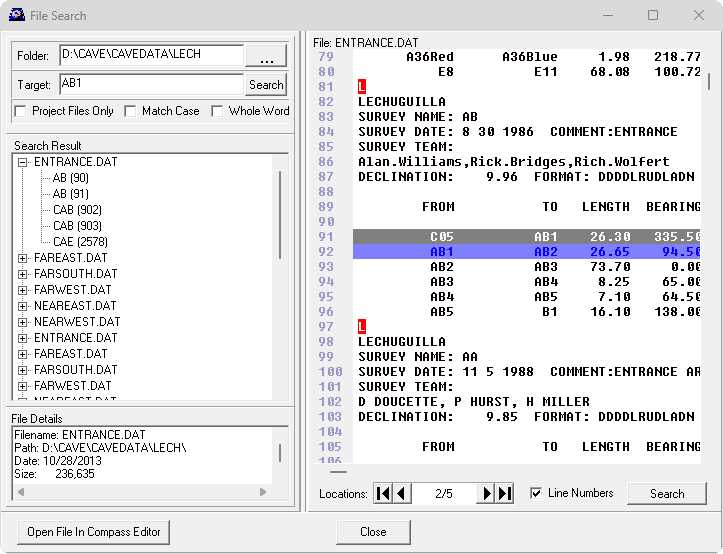
Project Manager Search Tools |
|
The Project Manager now has a search tool that
allows you to search Compass files for matching
strings. The tool can search through all the
files in a Project or all the files in a folder
and all its subfolders. You can search for any
text including station names, comments, survey
team members and even numerical values The tool
is very useful for organizing and tying survey
files together.
 |
|
Update - 12-19-23 |
|
Project Manager Improvements |
|
The Compass Project Manager has been extensively
rewritten to make it easier to build and
organize cave projects. Here is a list of the
new features:. |
| 1. Splay
Shots. There is now an
option to flag individual shots
as splay shots. Splay shots are
shots to a passage wall, which
are used to give a more precise
representation of the passage
shape. Shots flagged as
splay-shots are highlighted and
drawn with a user-selectable
color and dot pattern. |
 |
|
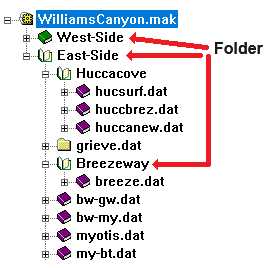
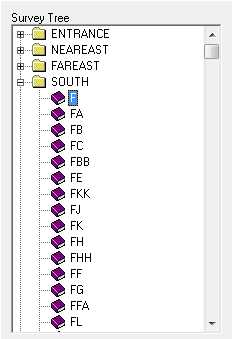
| 2.
Folders. Compass now has the option of having
Folders in a Project file. Folders allow
you to organize the data within a
Project by grouping it into separate
sections. For example, if you have a
large cave, you can group parts of the
cave together by area. Likewise, if you
have a regional cave project, you can
organize the data by area and cave.
For example, the following project
shows the caves around a Williams Canyon
in Colorado. As you can see, the folders
group the caves by side of the canyon
and by area where the caves are found. |
|
|
3. Date Animation. This feature
displays a series of cave plots each one showing
the extent of the cave at a particular point in
time. In this way, the program shows an
animation of how the exploration developed over
time.
| You have the option of
using color schemes that highlight the
most recent surveys, so the areas with
the most active exploration stand out.
Animations can be saved as AVI-Movie
files or GIF animations. The animated
GIF to the right show Lechuguilla
exploration over time. |
 |
|
|
4. Discovery Date. Compass now maintains
two dates for each survey, the Survey Date and
the Discovery Date. The Survey Date is the date
on which the current survey was surveyed. The
Discovery Date is the date the passage was first
discovered. In many instance the Survey and
Discovery date will be the same, but they can be
very different. For example, the passage could
have been discovered (and scooped) many months
or years before it was surveyed. Also, the
passage could be resurveyed one or more times,
in which case the Survey Date no longer
represent when the passage was first discovered.
The Discovery Date is useful for Date Animations
and Complex Plotting that use the date to
highlight or display certain sections of the
cave. |
|
5. Dynamic Labeling. The Viewer now
has the option of dynamically controlling the
spacing between labels. In the past, if you were
zoomed out on a large cave and enabled labeling,
the labels would be printed on top of each other
in a large mass. Dynamic labeling adjusts the
spacing so the labels never appear on top of
each other and they are always readable. If you
are zoomed out on a large cave, only a small
percentage of the labels will be printed. As you
zoom in and there is more space for labels, more
and more labels will be printed. When you are
zoomed in far enough, there will be enough room
for all labels and all labels will be printed.
|
 |
| This image shows Lechuguilla Cave
with station labels enabled. As you can
see, the labels are so crowded together
that you can't read them. |
|
 |
| This image shows the "Optimized
Labeled" mode. As you can see, the
labels are spaced so each label is easy
to read. Pay attention to label C05, in
upper part of the image. |
|
 |
| This image is zoomed on a
smaller portion of the cave. As you can
see, there is more room so more labels
can be shown. You will notice that more
labels have shown up around C05. |
|
 |
| This image is zoomed in on an even
smaller portion of the cave. As you can
see, there are more e labels shown
around C05. If you zoom far enough, all
labels will show up. |
6. Undo/Redo. The Project Manage now has
an "Undo" feature that allows to you to undo up
to 1,000 changes made to the project. This is
useful when you make a mistake and delete an
item from a Project or make a mistake the
project structure. Each time you press the Undo
Button, the program undoes a previous change.
There is also a "Redo" option that allows you to
redo changes you've made after you have undone
them. |
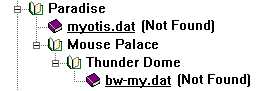
| 7. Not Found Feature. A
Compass Project File contains a list of
the survey files that will be processed
and viewed together. The Project Manager
now checks to see if the files are still
available in the specified location. If
they are not, Compass displays a warning
message in the file tree |
|
| 8. Moving Items.
Compass has always had the ability to
move items in the Project Tree by
dragging and dropping them with the
mouse. To make it easier to organize the
data, the mechanism for moving items in
the survey tree has been improved. The
drag-and-drop feature has been improved
to make it easier to move and place
items. |
| In addition, there are now
arrow-buttons that allow you to
precisely place items. |
|
9. Restoring Backups. Compass has
always saved backup files whenever you make a
change to a Project or a Data File. However, it
was something of a hassle to find and restore a
backup, in case you made a mistake. The Project
Manager now simplifies restoring backup by
display and list of the available backup and
allowing you to restore one with the click of a
button. The display also shows the contents of
the files and highlights the differences between
the current and previous versions:
|
|
10. File Explorer. To make it easier to
manipulate cave data and windows folders, you
can now go directly to the Windows directory of
the current project directly from the Project
Manager and the editor. |
|
Update - 3-3-23 |
|
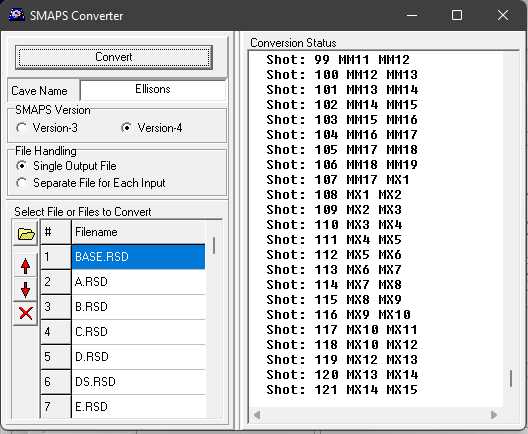
SMAPS RSD Import |
|
SMAPS is a cave survey program that ran under
DOS and was popular in the 1970's and 1980's.
The last version of SMAPS supported the import
and export through a file format called SEF.
Compass supports importing and exporting SEF.
Earlier versions of SMAP used a different format
called RSD. The DOS version of Compass could
import this format. However, it is no very
difficult to run DOS programs under Windows,
which makes it difficult to import RSD files.
For this reason, Compass now supports the import
RSD files. The tool will import multiple files
at once and has the option of importing SMAPS
Version-3 and Version-4 files.
|
|
Update - 11-27-22 |
|
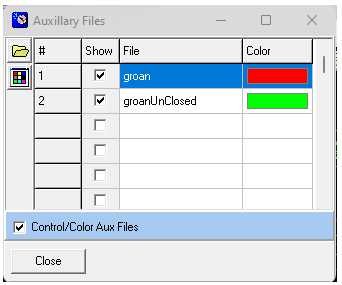
Auxiliary Files |
|
Compass now has an option to load additional
files into the Viewer on top of the base file.
This allows you to do things like compare
different versions of a cave survey. For
example, you could make close and unclosed PLT
files of a cave and then compare them. For
example, here is an image showing closed and
unclosed versions of Groaning Cave.
The files don't have to be the
same cave. As long the caves are referenced to
the same coordinate system and aren't too far
apart, two or more files can be viewed at the
same time.
You can selectively enable and
disable the display of files. You can also set
the colors for each file.
|
|
Update - 10-2-22. |
|
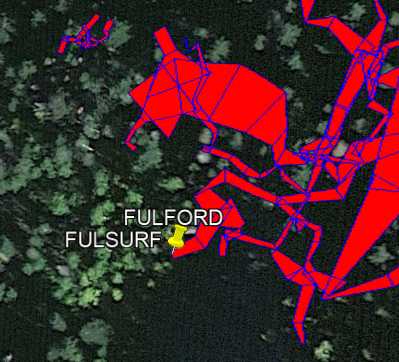
Improved KML Export |
| The KML
export feature now has the option of
saving with each section/file as a
separate object with its own label and
"pushpin." That is especially useful for
projects that contain multiple caves in
separate files. This feature make the
caves easy to identify in Google Earth
and you can click on individual item in
the Google Earth's "Places" list to zoom
in on a cave. |
|
|
|
Update - 1-10-22 |
|
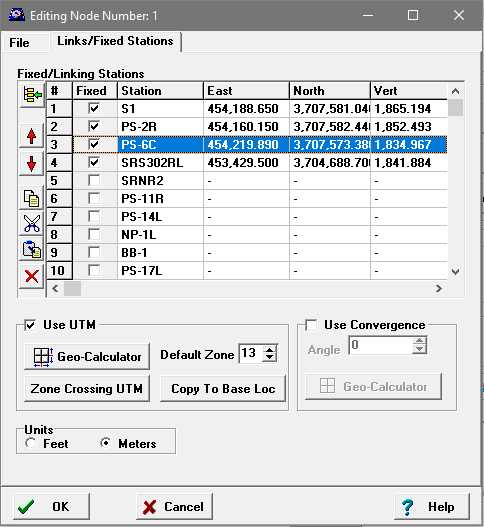
Improved fixed location entry |
| The Node
Editor has been improved to make it
easier and more intuitive to enter
Fixed-Station and Links. You can now
enter and edit values using
standard editing commands similar
to those used in Spreadsheets.
Fixed stations are easily specified
with a checkbox. You can cut, copy,
paste and delete one more rows of data
at the same time. Individual cells can
also be cut, copied, pasted, deleted and
edited. |
|
|
|
Entrance Relative Elevations |
| If you use
one or more fixed stations in a cave
project and you use an elevation that is
relative to sea level, all the
elevations in the cave will be relative
to sea level. This makes it hard figure
out the depth of cave.
Compass now gives you the choice of
displaying absolute, sea level
elevations or entrance relative
elevations. |
|
|
|
|
Label Sections. |
| The Viewer now allows
you to label sections of a project. Each
section represents a survey file. For
small caves, each file will contain the
survey for a single cave so each section
label will represent a different cave.
For larger caves, each file will
represent a section of the cave. |
|
|
|
Google Maps from Geo calculator |
|
 |
| The Geo-Calculator now allows you to
view a fixed station location in Google
Maps, which makes it easy to insure tha
the location is correct. |
|
|
Update - 12-10-21 |
|
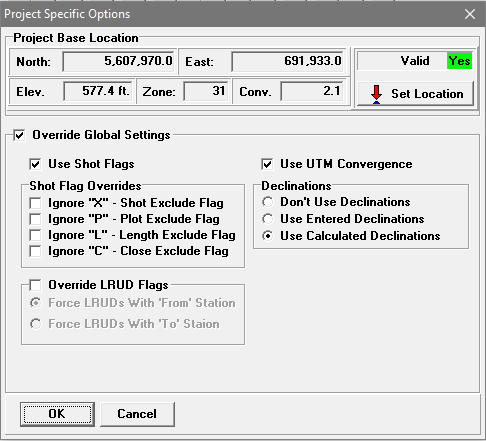
Project-Level Settings. |
Compass provides a wide range of setting that
control the way projects, surveys and shots are
processed. These options can be set at different
levels including the program, survey and shot
level. It is some times useful to override all
the options to make sure the cave data is
processed the same way on every machine. This is
useful when you have different surveys with
different settings. It is also useful when you
are sharing your survey data with other people.
| To solve this problem, Compass now
allows you to set Project Level options
that can be used to selectively override
most of the computer's default settings.
In this way, the cave data will be
processed the same way no matter what
country the computer is in or how it is
configured.
Since Compass allows you to have the
different projects for the same data,
you can process the data in different
ways depending which project-file you
use.
|
 |
|
|
Update - 8-29-21 |
|
The SVG Exporter Now Handles Database
Features. |
|
CaveBase,
the Compass database program allows you to
create inventories of cave features. For
example, you can mark the locations of
formations, fossils, artifacts, signatures or
any other feature in the cave that you want to
keep track of. In the past, only the Compass
Viewer could display these features. Now, the
SVG Exporter can include database features in
the exported or merged SVG files. This makes it
easy to add the features to hand-drawn, finished
maps.
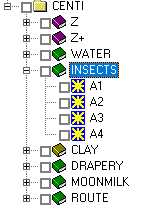
| Database features show
up in the survey list as green or olive
colored folders. You can enable or
disable the export of the features just
like you can for individual surveys and
shots. You have control over the color
and font used to mark and label the
features. It even allows you to export
SVG representations of fonts that are
only available under Windows such as the
WingDings, symbol font.
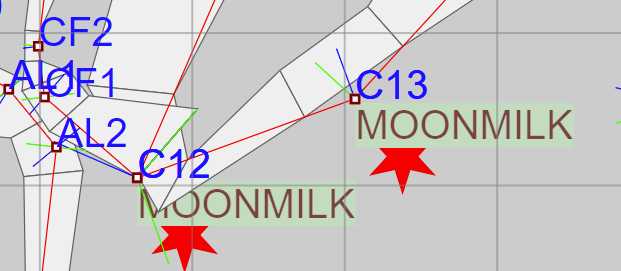
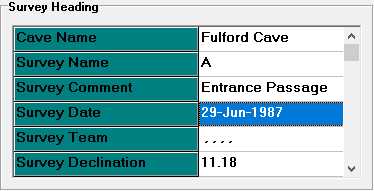
The image below shows the location of
moonmilk in Fulford Cave. The "Stars"
WingDing symbols are not normally
available in SVG files. |
 |
|
|
 |
|
Duplicates Stations and Markers eliminated
from SVG files. |
|
SVG files can be very large because of the
number of surveys shots in a cave. This can make
loading and working with the file into Adobe
Illustrator or Inkscape difficult and slow. One
of the reasons that the files can be large is
the fact that survey stations may appear
multiple times in the survey data. This result
in multiple copies of the same station label and
the same station marker.
To solve this problem, the SVG Exporter now
optimizes SVG files by removing duplicate
Station Names and duplicate Station Markers.
This can reduce the SVG file size by as much as
20%. |
|
Update - 7-8-21 |
|
Improved Animations and Passage Modeling. |
| There have been several
improvements to the Animation Tools in
the Compass Viewer. 1.
Interpolation. The interpolation
between animation points has been
improved to make it more linear and
smooth. In the past, the zoom would
happen faster than panning so the
animation would appear to zoom in before
it panned to the destination. This was
disorienting because you would be zoomed
so tight that you'd lose your
perspective on where you were going and
how you got there. |
 |
| 2. Animated GIFs.
You can now save cave animations as
animated GIFs. GIFs are a simple image
format that supports animation. Animated
GIFs are useful because all browsers
support them so they can be inserted in
web pages like the images to the right.
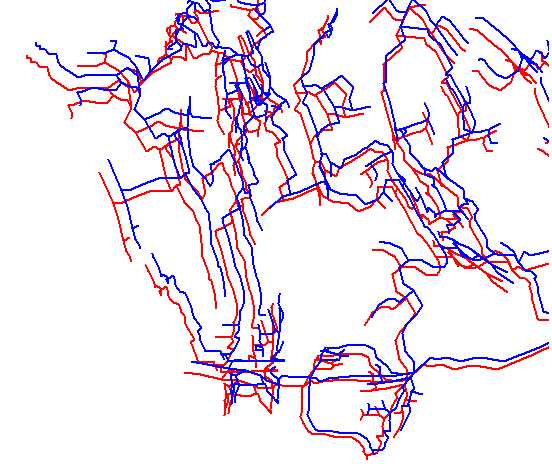
3. Distance Color/Passage
Modeling. The passage modeling fill
colors now support the option of
coloring by distance. In this mode, far
passages are colored a different color
from near passages. This makes the cave
look more three dimensional. |
 |
For example the image above colors far
passage blue and near passage red. Because of
the way the eye focuses different colors, the
blue passages seem further away. |
|
Update - 1-28-21 |
|
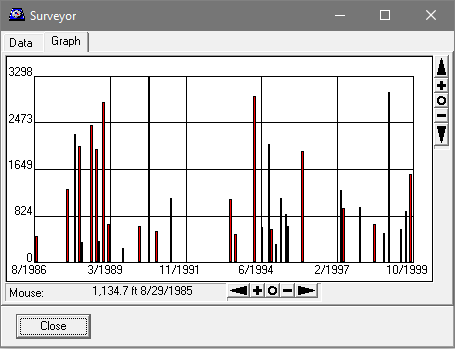
Graph Exclusions |
|
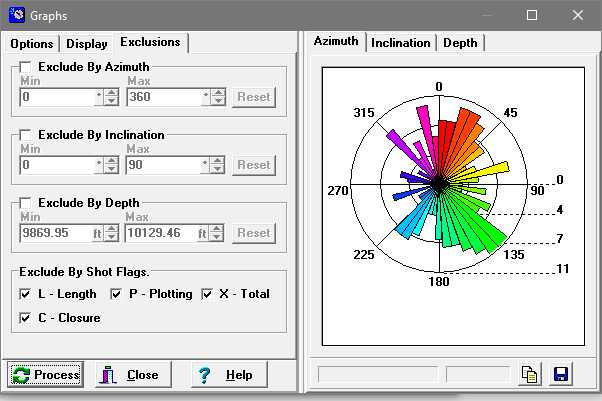 |
| The Graph Tool now allows you to
exclude shots that have the Length (L),
Plot (P), Total (X) or Closure (C) flags
set. This prevents shots that over
represent passage trends from
contributing to the analysis. |
|
|
Update - 10-4-20 |
|
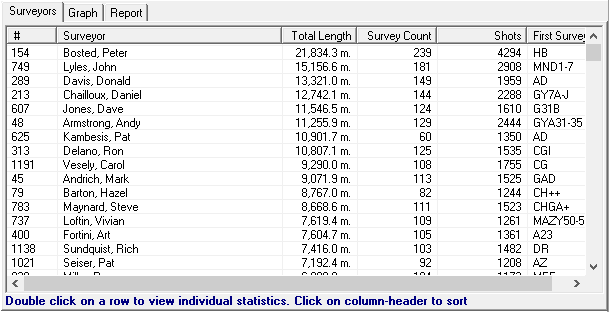
Survey Team Analysis |
|
Compass can now analyze all the survey teams
that have worked in a cave and display complete
statistical information on all surveyors who
have contributed to a project. The program
totals the length of all surveys worked on by
each surveyor, as well as all the number of
surveys and shots. |
 |
|
The display can be sorted by name, survey
length, survey count, and number of shots. This
makes it easy to see who has done the most work
and made the largest contributions to a project. |
 |
|
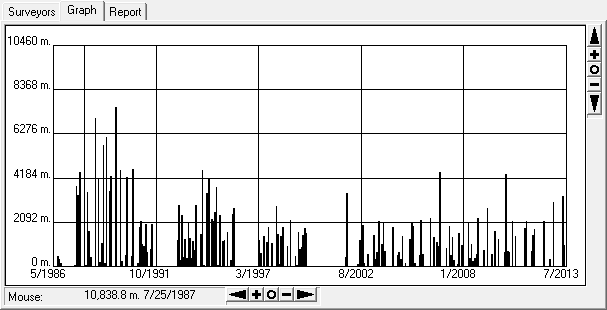
The program also displays a graph of the amount
surveying done on various dates through the
history of the survey. This makes it easy to see
periods when surveying is most active and when
surveying is dormant. |
 |
|
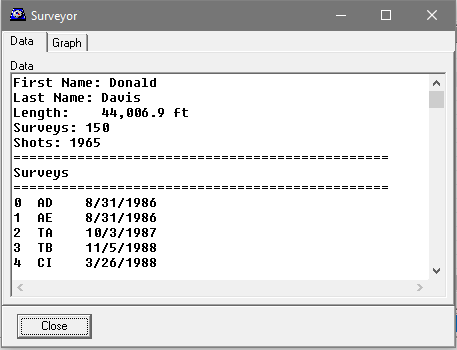
Similar information can be broken out by
surveyor, including which surveys a surveyor may
have worked on. Finally, there is a graph that
shows when a surveyor has worked on the project. |
|
 |
|
Update - 5-8-20 |
|
Incremental Improvements and Bug Fixes. |
| Column
Resizing. The Complex in the Viewer
now allows you to resizes columns on the
Color Surveys and Color Sections pages.
The corresponding buttons resize
accordingly. This makes it easier to see
larger survey names |
 |
| Month
Names. Windows allows you to specify
the format in which dates are displayed.
In the past, Compass only allowed the
entry of numerical months. Compass now
fully supports all Windows data formats,
including the display and entry of month
names. |
|
|
|
Update - 1-13-20 |
|
New Magnetic Declination Models |
|
All the Compass programs that calculate magnetic
declination, including the "Geo-Calculator,"
have been updated to use the latest models. The
program will now calculate magnetic declination
for any year from 1900 to 2025. |
|
Update - 12-20-19 |
|
Blunder Location -
Improvements to the Tie-In Tool. |
|
One of the most common ways of causing is a
large error in a cave survey is by tying a shot
to the wrong station. For this reason, one of
the Compass blunder tools, displays a list of
shots that may be tied to the wrong station.
One of the ways that mis-tied shots can occur
is by making a typo during data entry. When
there is a typo during data entry, the correct
and incorrect names will be very similar. For
example, if you meant to type ABC1 and
you accidentally ABD1, the two names
would only be different by one character. If you
saw those name in
To help determine if the blunder is caused by
a typo, Compass now displays a count of the
number of characters that different between the
old and new tie-ins. This makes it easy to find
shots where the old and new tie-ins that have
similar names and might be mis-tied: Here is a
picture of the Tie-in list:
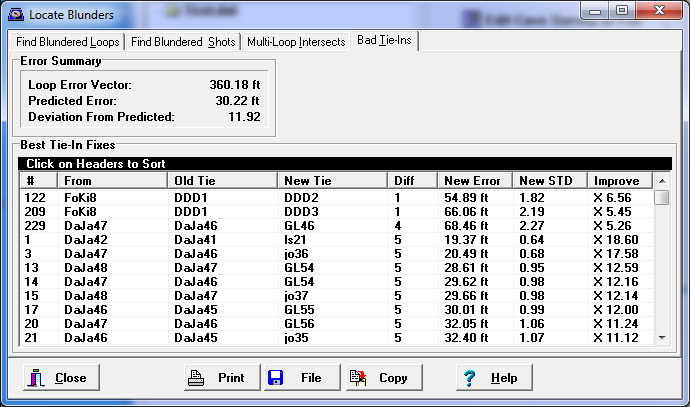
The column label "Diff" shows the difference
between the old and new tie-ins. As you can see,
there are two shots where the difference in
tie-in station names are only one characters.
Those are places where there may have been a
typo during data entry, especially considering
that changing the tie-in, reduces the error from
300 feet to 54 and brings the STD from 11 to
1.8. |
|
Update - 10-25-19 |
|
Navigation |
|
The Viewer's navigation controls have
been extensively reworked to make it
easier to move around through the cave.
Here are the highlights:
1. Drag mode option is enabled by
default. The Viewer has two mode of
navigating through a cave:
Box-Mode and
Drag-mode. In box-mode, the
mouse manipulates a selection box that
shows you exactly what part of the cave
will be selected. In drag-mode, the cave
is dragged by the mouse to whatever
position you want.
Since the drag-mode is more intuitive
and allows easier control of the cave,
drag-mode is enabled by default.
2. Control turns on Drag-Mode.
Holding down the control-key,
unconditionally enables drag-mode. This
is useful when you are using one of the
Tools, which takes over the mouse. For
example, if you are using the
Find-Survey tool, the mouse-navigation
features don't work because the tool
uses the mouse to find surveys and
stations. Holding down the control-key
overrides tool, and the program switches
to drag-mode. This makes it easier to
navigate while you are using tools. |
|
3. Animated Zoom.
You can now double click anywhere on the
cave and Compass will pan and zoom into
the spot where you clicked. The pan and
zoom are animated, so it smoothly
transitions from the current view to the
new on. This makes it less confusing
than instantly jumping from one view to
another.45 |
 |
|
4. Quick Compile and View. A
common data-entry operation is making
changes to the data and then viewing the
result. To do this, you have to reload
the cave into Viewer, which resets all
the panning, zooming and rotations. The
Viewer now has the option of reloading a
cave without resetting the pan, zooms
and rotations. In addition, there is a
quick-compile button in the Project
Manager that compiles the project
without running a new copy of the
Viewer, All you have to do to view
changes, is press the quick-compile
button and reload the cave in the
Viewer.
5. Fixed Loops.
If a cave has two or more fixed stations
that are connected by a survey, this
will form a loop. Part of the loop
is made up of the shots that connect the
fixed-stations and part is made up by an
imaginary line that connects the
two fixed-stations. In other words, only
part of the loop is made up of surveyed
shots and part is made of an imaginary
shot-line. Compass now tracks each part
of the loop separately. Among other
things, this is useful for determining
if a loop is a natural loop or an
artificial loop that only exists because
of fixed stations. |
|
|
Update - 10-18-19 |
|
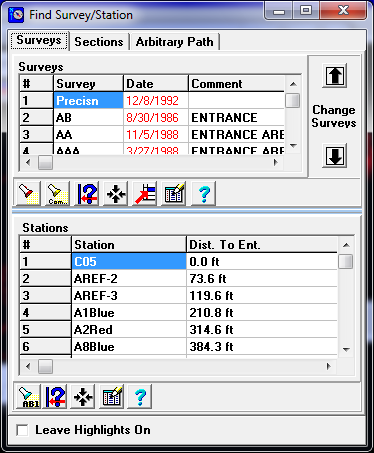
Improved Survey Finding Tool. |
| The Survey/Station
finding tool has been improved to make
it easier to find surveys and stations.
The new version of the tool puts both
the survey-list and the station-list on
the same page. When you select a new
survey from the list, the corresponding
stations instantly appear in the
station-list so you don't have to switch
back and forth between the two page. At
the same time, the survey and the
selected station
|
|
|
|
Update - 6-29-19 |
|
Non-US Date Formats |
The Compass editor now supports non-US date
formats. The US date format is typically
mm/dd/yyyy, where as the format for other
countries can be virutally any other pattern.
For example, many countries use this date
format: yyyy/mm/dd. Compass now tracks the
order specified in the
Windows regional settings.
|
|
Update - 6-1-19 |
|
Compass Website, SSL and HTTPS |
A few months back I received some emails from
people complaining that they were having
problems accessing the Compass web site. When
they went to the Compass web site, they would
get a message saying the web site was unsafe and
warning them not to enter. When I tested the web
site, I didn't get the message. I tested it in
several browsers and didn't see a problem, so I
assumed it was an erroneous message.
A few days ago I received notification from
Google that they want all web sites to use SSL
encryption so people can connect to web sites
using HTTPS. They warned that web sites not
using SSL/HTTPS might be blocked. That made me
realize that Google had probably rolled out the
feature early in some parts of the world and
that was causing the warning.
The Compass web site uses
CloudFlare,
which makes it easy to switch on SLL and allow
HTTPS encryption. The Compass web site has been
switched over so traffic can now use SSL
encryption. I've also configured it to force SSL
encryption even when the browser doesn't request
it.
The Compass web site was never really unsafe and
now it is even safer. If you have been avoiding
the Compass web site because of the warning
messages, they should now be gone now. I
apologize for any inconvenience this may have
caused. If you notice any problems with the
change to SSL, please let me know. |
|
Update - 6-21-18 |
|
Shapefile Export Improvements |
|
The 3D Exporter in the Viewer now creates a
".prj" "projection-file along with the other
shapefile components. Also, since some programs
prefer to have shapefiles zipped before they can
be loaded, you have the option of creating a zip
file that includes all the component files. |
|
Update - 5-15-18 |
|
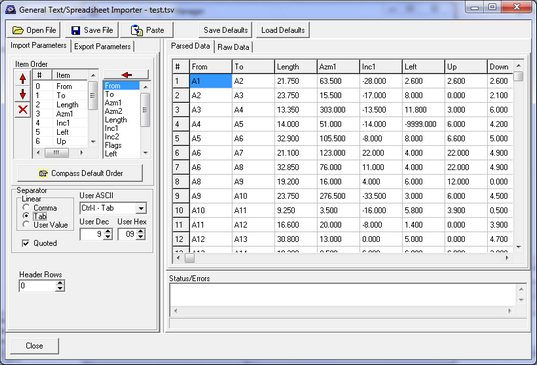
General Text/Spreadsheet Importer |
|
There is now a general-purpose import tool that
can read text files of virtually any format and
convert them to Compass files. For example, it
can import standard spreadsheet and database
format such as comma-separated files and
tab-delimited files.
You can choose any ASCII character as the
separator. You can also choose any data order.
Imported data is saved to standard Compass files
so it can be used with any Compass project.
For more information,
click here. |
 |
|
Update - 1-3-18 |
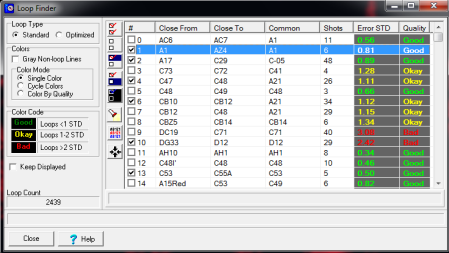
| Improved
Loop Display In Viewer |
|
The Viewer now has improved Loop tools. It can
now color-code the loops according to the errors
in the loop. Loops whose errors exceed 3
standard deviations are color coded red. Loops
between 2 and 3 are color coded yellow and loops
less than one are color coded green. This allows
you to see which parts of the cave have the most
errors and are the least accurate.
The new version also allows you to color the
non-loop part of the plot gray to make it easier
to see the loops. Finally, the new version
allows you to sort the loop-list by column. In
other words, you can sort the list by error
level, number of shots, common shot etc.
The new features can make it easier to find
and correct errors. For example, the image to
the right shows a portion Lechuguilla cave with
loops highlighted according to error level. As
you can see, the errors tend to concentrate in
certain areas of the cave. This may indicate
that certain survey teams, certain instruments
or certain eras of exploration produce more
errors. It also may indicate that a poorly
surveyed passage is shared among several loops. |
 |
 |
|
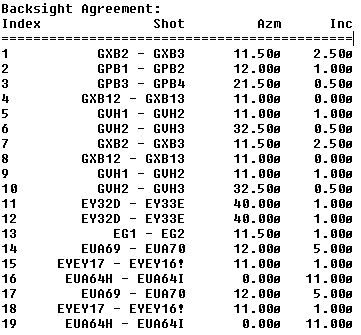
Backsight Agreement Statistics. |
| The Project Manager
now has the option of displaying a list of all
shots that include backsight information. Each
item shows the difference between the fore and
back-sight values. You can limit the list
to items where the fore- and backsight
difference exceeds a certain value. For example,
you can limit the list to shots where difference
between fore and back compass values exceed 2
degrees. This is very useful for zeroing
in on shots or surveys that need to be
resurveyed. It is also useful for finding
transcription errors. |
 |
|
Access Editor from Blunder Detection Tool |
| It is often useful
to make changes to the data while you are trying
to find and correct errors and blunders in
loops. To make this easier, you can now access
the editor directly from the Blunder Detections
Too.. |
 |
|
|
Update - 8-20-17 |
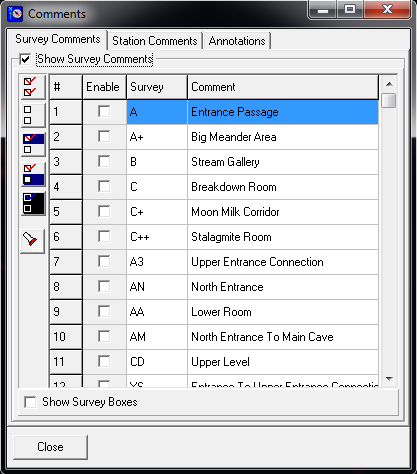
| Display
Survey Comments, Station Comments and
Annotations. |
| Compass now has the
ability to display Survey and Station comments
in the line plot. You can also add Annotations
to the display that weren't originally entered
in the Editor. These annotations can be saved to
one or more separate files so you can use
different annotations for different
circumstances.
You can selectively enable the display of any
combination of comments of individual Survey
Comments, Station Comments and Annotations.
The image to the right shows the new tool
that is used to selectively display
survey-comments. Checking the box next to any
survey-comment will cause that comment to be
displayed in the plot. Like wise, un-checking
the box next to a survey, hides the comment for
that survey.
|
 |
| The
tool bar on the left allows you to check large
blocks of surveys at once. The buttons in the
tool-bar allow you check or clear all the
surveys with one click. They also allow you to
set, clear or toggle large blocks of highlighted
surveys. Finally, it also allows you to search
through the list for a specific survey, comment
or certain words in a comment. |
| The new features
also allow you to display a 3D box that shows
the extent of the survey. You have complete
control over the font and color of text used to
display the comments. Likewise, you have
complete control over the color used to display
the 3D boxes. The image to the right shows the
survey comments and boxes for the selected
surveys shown above. The image shows the
Entrance section of Lechuguilla Cave.
Similar features are available for
station-comments. Plus, if you put a special {P}
symbol in a station comment, the Viewer will
automatically check that comment when the
plot-file loads
Survey comments are displayed at the
bottom-left corner of the survey extent. Station
comments are placed next to the station. |
 |
|
|
Update - 5-24-17 |
|
New Version of CaveXO
3D Cave Viewer |
|
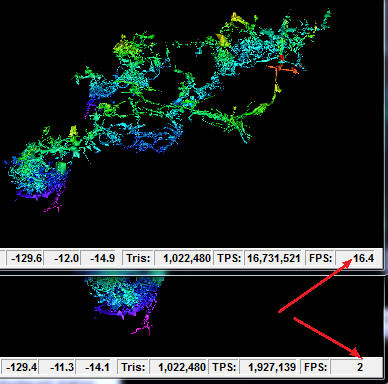
Speed Increases.
CaveXO is now many times faster than
previous versions. Caves now load and
animate much faster. |
|
1. Load Speed.
For example, here are the load speeds
for 124 miles (198 km) of Lechuguilla
Cave:
Old Version: 32
seconds.
New Version: 6 seconds.
That is more than five
times improvement.
2. Animation Speed.
Here are animation speeds for
Lechuguilla:
Old Version: 2
Frames/Sec.
New Version: 16.4 Frames/Sec
Old Version: 1.7
million triangles/sec
New Version: 16.7 million triangles/sec
The increase in
display speed makes it much easier to
animate large caves like Lechuguilla.
These times are for a somewhat older
graphics card, newer computers and
graphics cards should be much faster. |
  |
|
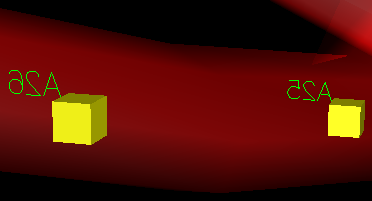
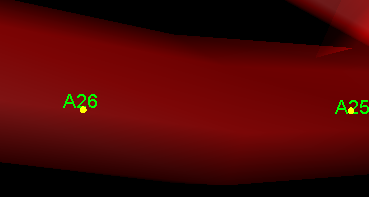
Improved Station
Labels/Marks. The old version
displayed station labels with text that
was drawn using scaled lines. This meant
that if you were zoomed out, the text
was too small to read and if you were
zoomed in, the text could be too big to
read. Also, the labels only faced in one
direction, so you couldn't read them
from the side and would be backwards if
you looked at them from behind.
The new labels are a
fixed size, no matter how much you are
zoomed in or zoomed out. Likewise, they
always face toward the front, so they
can be read from any angle.
Finally, in the old
version, station marks consisted of a
small cube or tetrahedron, which was
very small when you zoomed out and got
progressively larger when you zoomed in.
In the new version, station labels stay
the same size whether you are zoomed in
or out. They also face the same
direction |
|
|
New Compass Features
Editor |
|
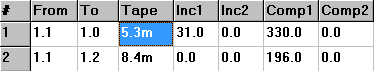
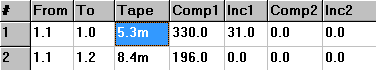
Although the Compass
Editor has always allowed you to set the
order of the shot measurements, the fore
and back compass and inclination
measurements were always grouped
together. The new version of the editor
allows complete freedom to put the
measurements in any order you want.
|
 |
|
 |
|
|
Update - 12-11-16 |
|
Display Closure Exclusions and Length
Exclusion. The Viewer now has the
ability to high light shots that have
been excluded from loop closure. The
option is enabled by selecting the
"Display->Show->Show Closure Excluded
Shots from the Viewer menu bar. All
shots that were excluded will then be
highlighted. It also has the option of
highlighting shots that have been
excluded from the length totals. The
option is enabled by selecting the
"Display->Show->Show Length Excluded
Shots" from the menu bar.
These options are useful
when you are trying solve loop closure
problems, find errors and looking at an
overview of how the survey data is
organized. |
 |
|
|
Update - 10-22-16 |
|
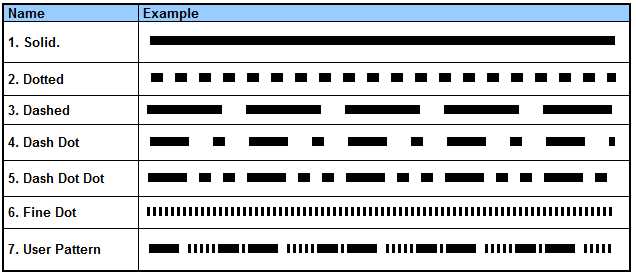
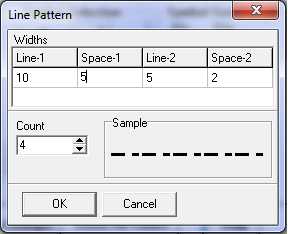
Patterned Lines. The Viewer now has
the ability to draw plot lines using
combinations of dotted and dashed lines.
This makes it easier to distinguish
different parts of the cave,
particularly when the cave is printed
using black and white colors.
You can use different
dot/dash patterns for different surveys
or sections of the cave. The
dotted/dashed lines can be combined with
other properties such as color, and line
thickness to emphasize or distinguish
certain part of the cave.
|
 |
|
|
 |
| There is a
standard set of dotted and dashed lines.
|
 |
|
Custom Patterns.
In addition to the standard line
patterns, you also create custom
patterns. The patterns created by
specifying widths of the lines and
spaces that make up the pattern. You can
enter up to 16 widths to form
complicated patterns of dots and dashes.
This is useful printing on high
resolution printers where the pixel
resolution is too high for the dots/dash
to be seen. |
|
|
| There have 10
other improvements and bug fixes to Compass in
the last year. Click
here for a complete revision history |
|
|
Update - 9-5-15 |
|
General Improvements. |
1. Survey
Manipulation Tool. The Survey Manipulating
tool has several improvements.
A. The Up/Down arrow
buttons can move multiple surveys at once.
If you have more than one survey
highlighted, all of them will move when you
press the up/down arrow buttons.
B. You can now drag and drop multiple
surveys at once. If you have multiple
surveys highlighted all the highlighted
surveys will be moved.
C. You can now delete multiple surveys at
once. If you have multiple surveys
highlighted all the highlighted surveys will
be deleted. The program will warn you before
the files will be deleted.
D. The Up/Down arrow buttons will auto
repeat if you hold the button down. This
speed up the process of moving surveys into
position.
|
 |
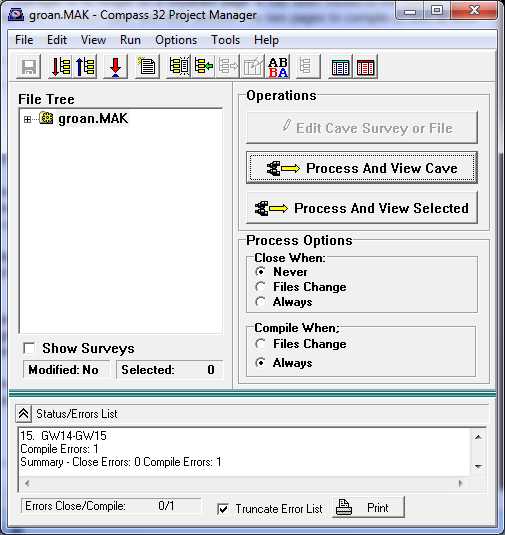
2. Project Manager Error Log.
The "Error Log" in Project Manager is no longer on a
separate page. It has been moved to the bottom of the
main window. This avoids the need to switch back and
forth between the two pages to compile or look at error
messages.
3. Passage Models. The Project
Manager now generates more accurate passage wall models.
In the past, when Compass processed junctions, it used
the last LRUD for all shots radiating from the From
station. Now it uses the LRUD associated with each
shot's From station unless the data is missing. If the
data is missing it uses the best LRUD for that station.
4. Line Size. The Viewer now allows you to set
the line size for the shot lines, features and the
passage walls separately. These sizes can also be saved
as defaults.
5. Help Files. All the Compass help files have
been improved by adding dozens of new screen images of
the Compass programs, dialog box and screen displays.
This should make it easier for people to following the
instructions in the help files.
6. Pocket Topo Imports. I have
fixed several problems with the Pocket Topo import
feature. |
|
Update - 8-22-15 |
|
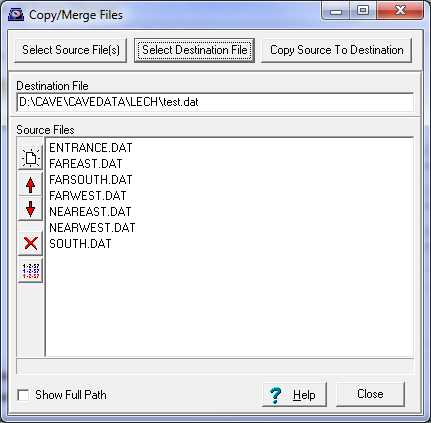
Merge File Tool |
| The Project Manager now
has a tool to make it easier to merge two or more survey
files into a single survey file. You simply create a
list of the files you want to combine, specify a
destination file and Compass will merge the files into a
single file. The files can come
from any where so you can combine different directories,
different drives and different devices. You can also
drag the files to the list from any Windows file folder.
The files can be combined in any order. The input file
list can contain the output file because program does
not overwrite the output file until all the files have
merged together. This allows you to add or concatenate
new files to existing file. To protect you from
accidently overwriting valuable data, the program
creates multilevel backups for the destination
file. |
 |
|
Update - 2-24-15 |
|
New Installer |
| As pointed
out earlier, the Compass programs and installation
packages are now digitally signed with a Windows an
Authenticode Certificate from
Comodo.
This allows anyone to check the authenticity of Compass
files to insure that they haven't been tampered with or
corrupted. The purpose was to prevent antivirus programs
flagging and removing Compass files. It turned out that
this was not enough to deal with all the antivirus
programs. As a result, the Compass installer has been
upgraded to one that is recognized by antivirus program.
This has eliminated almost all downloading and
installation problems.
Click here
for more detailed information on the problems and how to
deal with them.
|
|
Update - 2-14-15 |
|
Import PocketTopo Files.
|
| Compass can
now import PocketTopo files and convert them to the
Compass data format. |
|
Compass Files Digitally Certified and
Signed. |
Windows and Antivirus programs are now
getting more and more picky about what programs they
will allow to be installed on a computer. Many antivirus
programs rely on the creation date of a program to
determine how safe the program is. New programs are
often flagged as unsafe because so few people have used
them that they the antivirus program will be worried
that the file might not have made it into the
virus/malware databases. Since I frequently update
Compass with new features and bug fixes, Compass
programs are often just a few weeks old. As a result,
they are often flagged as suspicious.
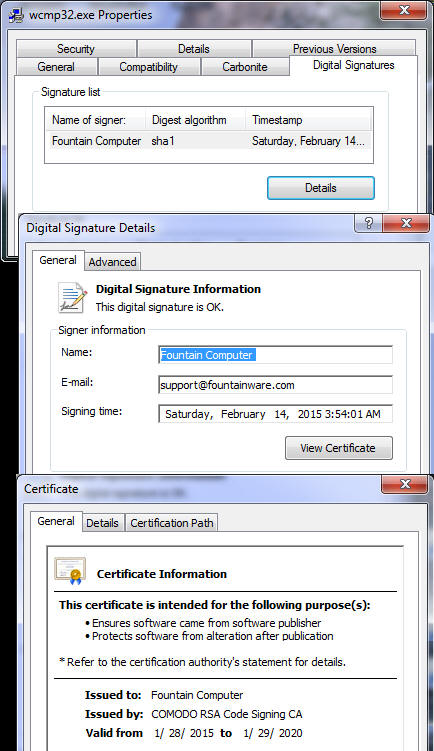
| To solve this
problem, all Compass executable files are
digitally signed using an
Authenticode Certificate from
Comodo.
Before I could get the certificate, I had to
verify my address and business credentials. Once
I had the certificate, I could sign all my
executable files with a code that cannot be
forged. The certificate ensures that the file
came from Fountain Computer and that it hasn't
been tampered with. As a result, Antivirus
programs are less likely to flag it and Windows
won't warn you about the trustworthiness of the
file. There still may be some issues at first,
but as the Fountain Computer digital signature
makes it into more databases and develops a
trustworthy reputation, the problems should
fade.
If you have any question about
the authenticity of any Compass executable file,
you can verify that the file right from Windows
in a few seconds. Just right click on the file,
choose the "Properties" option and select the
"Digital Signatures" page. If the Digital
Signatures page does not exist, it means the
file has not been signed. If the Digital
Signatures page does exist, it will give you
detailed information about the certificate.
All the details should match Fountain Computer
through Comodo. |
 |
|
|
Update - 1-10-15 |
| Magnetic
Declination Models. The magnetic declination models
have been updated to use the latest data. Compass can
now calculate declinations for any date between 1900 and
2020. The new data has improved accuracy for dates
between 2010 and 2015. The changes apply to the main
Compass distribution package and the Dem Reader. You can
down load these programs
here. |
|
Update - 11-20-14 |
|
I. Hidden Shots |
|
Each shot that is entered into the Editor can be marked
so it is excluded from plotting using the "P" flag. You
now have the option of displaying those hidden shots. To
display hidden shots, select the "Display -> Show ->
Show Hidden Shots" option from the menu bar. When the
"Hidden Shots" mode is enabled, the program will display
and highlight the excluded shots. The Highlight Color is
controlled by the "Feature Highlight" color in the
"Color/Fonts Dialog Box" "This option does not display
shots that were flagged with the "Total Exclusion"
"X-Flag." When hidden shots are displayed, all other
options are enabled. For example, if station labeling is
enabled, station labels will be displayed along with the
hidden shots. The Hidden Shot feature does not support
passage modeling.
Note: You must recompile your caves with the
latest version of the Compiler before the feature will
be available. Old versions of plot files and older
versions of Compass don't support this feature. |
 |
|
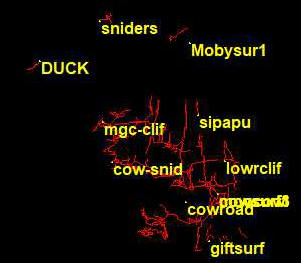
Here is an image of Fulford Cave showing
small, nearby caves disconnected from the main cave.
This is because the surface surveys are hidden using the
"P" plot-exclusion flag. |
|
 |
|
Here is an image of Fulford Cave showing
the hidden shots.The hidden shots are highlighted using
a user-selectable color. |
|
Update - 7-6-14 |
|
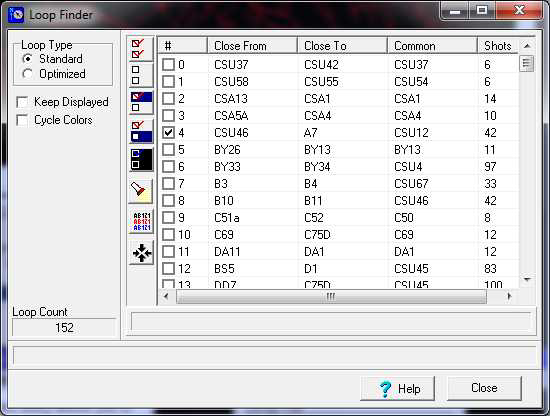
I. Loop Viewing Improvements |
| The Loop
option in the Viewer has been enhanced. It now shows two
different types of loops: Standard and Optimized.
1. Standard Loops are the same loops used to close the
cave and the same loops used by the Project Manager to
calculate loop statistics and locate blunders. They have
the same name and order as the loops shown in the
Project Manager. You would use this option when you are
trying to understand loop errors or fix blunders.
2. Optimized Loops are calculated on
the fly from the compiled data, optimizing the loops for
minimum overlap and minimum size. As a result, the order
and configuration of the loops may be completely
different from those presented in the Project Manager.
Certain loops, such as those that are closed via Fixed
Stations, will not appear in the Optimized loops.
Likewise, shots that are excluded from plotting won't be
shown. You would use this option when your are trying to
find minimum sized loops for resurvey work.
|
 |
|
 |
|
II. Viewer Menu Reorganization. |
|
The menu system in the Viewer has been completely
reorganized to make it more logical and easier to use. Since people
are used to the old system, they may not be able to find certain
features. To solve that problem, I've created an
alphabetized table of commands
that will help figure out where the your favorite features have
moved. The table of commands is also available in the Viewer help
files. |
|
Update - 4-22-14 |
|
Plot To Dat Converter |
| This new
Compass utility allows you to
reconstruct surveys from Compass PLT
files. This is useful when the original
survey files have been lost and you only
have access to PLT files. The Program
generates a Project File and all the
individual data files for the Project.
The program won't
generate an exact duplicate of the
original survey files. This is because
compiling survey data into a PLT file
may change things in the data. For
example, loop closure, magnetic
declination and UTM convergence alter
the station positions so that when the
surveys are reconstructed, shot length,
compass and inclination angle will have
changed. Nevertheless, compiling the
reconstructed survey files will produce
an exactly duplicate of the original
line-plots |
|
|
Update - 3-17-14 |
|
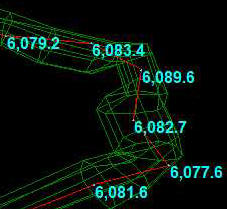
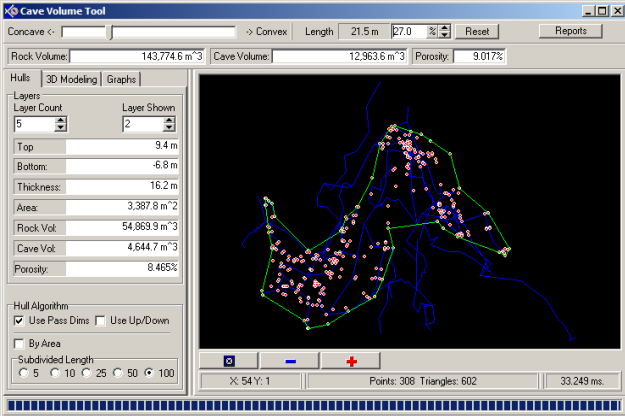
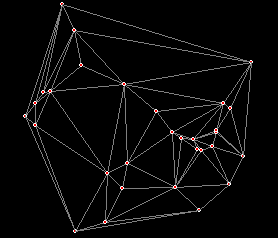
Cave Volume Tool |
|
Compass now has a special
tool to more accurately calculate cave
volume, rock volume, overall cave
density and porosity. The Tool is built
into the CaveXO 3D passage viewer. |
|
 |
|
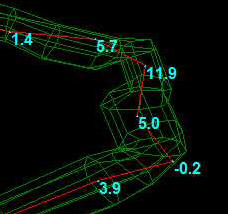
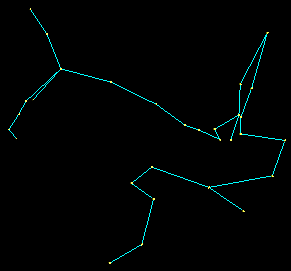
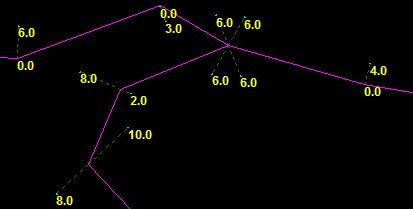
Points. The program
starts by extracting a set of points
that correspond to each station in the
cave. Those points define the boundaries
of the cave.
The image to the below shows a simple
cave, with the blue lines representing
the survey shots and the yellow points
representing the survey stations. |
Triangulation. The
program then breaks these points down
into a set of triangles. (This set of
triangles is called the Delaunay
Tessellation.) The triangles for sample
cave are shown in the image below.
The triangles will be used analyze
the points and will be used to create a
bounding box that closely approximates
the shape of the cave. |
 |
 |
|
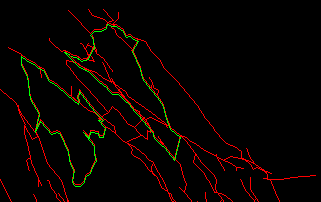
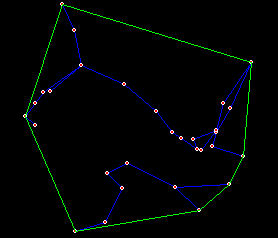
Convex Hull. The
program then uses the sides of the outer
most triangles to enclose the points in
a polygon. This polygon is called a
Convex Hull because no part of the
polygon is concave. In other words, no
part of the polygon deviates into the
cluster of points. The image to the
right show the cave enclosed in a Convex
Hull. Concave
Hull. Because the cave may have gaps
in the mass of points, the program needs
to generate polygon that traces these
gaps. A Concave Hull will follow the
gaps. A Concave Hull is generated by
selectively removing outer triangles and
drawing the polygon into the space left
behind. |
 |
Only triangles with an exposed sides
longer than a minimum length are removed
and the triangles with longest exposed
side are removed first. By adjusting the
minimum length, you can control the
depth of the concavity.
The image to the right shows the same
cave passage and stations with a Concave
Hull around it.
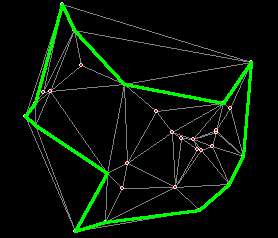
Anomalies. Since
the program works by analyzing the
positions of survey stations, the Hull
may sometimes cross the passage. That
would mean that part of the cave would
fall outside our bounding box.
|
 |
|
To solve this problem,
the program has the option of adding
extra points along the path of the
passage, For example, you can add points
that represent the Left and Right
passage walls. You can also subdivide
passages that are longer than a certain
length This helps prevent the passages
from falling out the of hull. |
|
 |
|
In the bottom center of
the first image above you can see the
hull crossing the blue shot-line. In the
next image, the passages have been
subdivided to add additional points have
been added along the length of the
passage. Points for the LRUD passage
dimension have also been added.. As you
can see, the hull no longer crosses the
passage. |
|
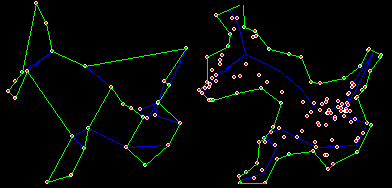
Layers. Since
caves are three-dimensional object,
different levels of the cave can have
different outlines. For this reason, the
program allows you to process the cave
in layers. |
|
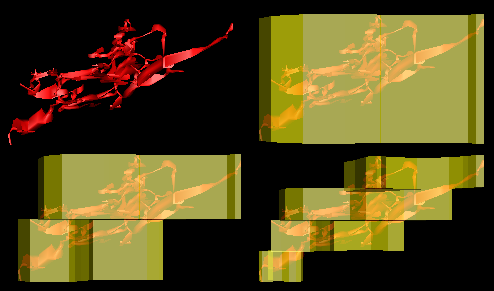 |
|
The first images to the
above shows a cave without any layers.
The next three pictures show the cave
enclosed in one, two and four layers of
Concave Hull. Generally speaking, the
more layers, the more exactly hull fits
the cave. |
|
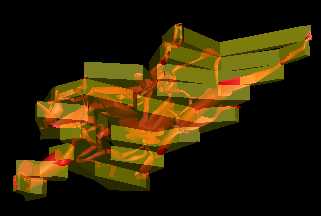
3D Display. CaveXO
allows you to visualize the 3D bounding
box. The bounding box is represented by
a transparent outline that shows how
each layer is wrapped around the cave.
This allows you to see how close the box
conforms to the cave passage. As you
make adjustments to the bounding box,
the display is updated in real-time so
you can instantly see how your changes
affect the the bounding-box. This
allows you to make adjustments to more
fully wrap the cave passages. You have
control over the transparency and the
color of the bounding box. |
 |
|
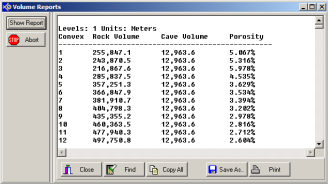
Reports. The
Reports Dialog allows you to build
text-based reports of the Rock Volume,
Cave Volume and Porosity that includes
all possible Convexity Settings and all
possible number of Levels. In other
words, the program will calculate the
values for each Convexity 1, 2, 3, 4 all
the way to 100 and all Levels 1 through
10, for a total of 1,000 values.
The values will be displayed in the
box on the right side of the window. |
 |
|
Blunder Detection Tool |
|
The Compass Blunder
Detection tool has been improved to make
it easier to find the worst loops in a
cave. You can now click on any column in
the loop list to sort the items in the
column in ascending or descending order.
This makes it is easy find the worse
loops in terms of the various measures
of loop quality shown in the tool. For
example, in the image shown below, the
Vector Standard Deviation error column
has been sorted from worst to best. This
put the worst loops a the top of the
list. |
|
 |
|
Update - 2-20-14 - Cumulative Update |
|
Viewer Line Width
Option.
The Complex Survey features of the
Compass Viewer now supports the option
of selectively setting the line width
for Survey and Sections. This makes the
passages stand out from the smaller
lines in the rest of the cave.
The feature is useful
for highlight routes and to make them
more visible in a cave map. It is also
useful for emphasizing an area of the
cave for presentations and publications.
Like other features in the Complex
options, the line-width feature can be
combined with other features for more
dramatic effect. For example, the image
to the right combines yellow coloring
with and a 3-pixel line-width to
emphasize a particular route through the
cave. |
 |
|
MapToDat. The
MapToDat survey-reconstruction tool has
been improved so you can generate branch
surveys and survey loop. Branches are
created by going back and selecting a
different starting station. Once this is
done, the next time you click on a
location a line will be drawn of the
selected station to the new point,
thereby generating a side branch.
Loops are generated by
selecting one station of the
closing-station pair, holding down the
Alt key and clicking on the other
station. There is more information about
MapToDat further down the page. |
 |
|
Correcting Magnetic
Anomalies. Magnetic Anomalies can
have large effects on cave surveys, even
causes big distortions to a cave map. If
you have backsights and a bit of
additional information, you can find and
correct these anomalies. John Halleck
has written about extensively, but the
process is a bit complicated and there
are a lot of important details you have
to get right. As a result, I have
written a tutorial with step-by-step
procedures for finding and correcting
anomalies.
Click here to read the full
tutorial. |
 |
|
Saving Quad Maps.
You now have the option of saving the
plot data from each section of a quad
map. This is useful when you are working
on a project where individual
cartographers are assigned to to
different quads. It is also useful for
exporting the individual quads to Shape,
DXF, KML or VRML files.
Click here
for more information on Quad Maps. |
|
Update - 12-17-13 |
|
Back Sight Correction
Factors. Compass now supports
correction factors for back sight
instruments. You can correction factors
for Compass and Inclinometer that are
applied to the values separately This is
used the case where a separate set of
instruments is used for back sights.
There were also 20 updates during 2013
that included bug fixes, improvements
and new features. |
 |
|
For example, you can now
adjust the position of station labels in
both the X and Y directions separately.
You also have control over the shot line
width. For a complete list of changes,
click here.
|
|
Update - 9-2-13 |
|
Survey Reconstruction
Tool. I've had a number of people
report that they are working caves where
some of the original survey data has
been lost and all that is left are paper
maps or sketch maps. Often times these
surveys are in remote parts of the cave
that are difficult reach or in parts of
the cave that are not actively being
explored or surveyed. It can be
difficult to get surveyors to return to
the area and resurvey the passages. In
these situations, the only recourse is
to reconstruct the surveys from the
paper maps. |
|
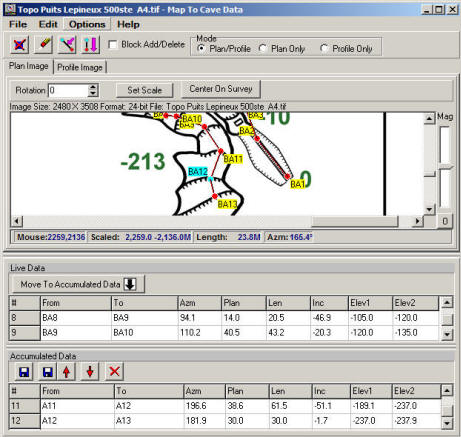
MapToDat is a
program that allows you to reconstruct
cave survey data from a paper or scanned
map when the original data is lost.
Ordinarily, recovering cave survey data
from a paper map would require manually
measuring the station positions, compass
angles and shot lengths using rulers and
protractors. After that, you'd need to
perform a series of trigonometric
calculations to convert the measurement
to cave data. Finally, the data would
have to be entered into the Survey
Editor.
|
 |
|
MapToDat Automates
and simplifies the process. You simply
load a scanned image of the map into the
program and then click on the survey
stations in the map. The program
automatically calculates compass angles
and shot-lengths for each shot. If have
both a Plan and a Profile map, the
program can also calculate inclinations
from the Profile Map. If you don't have
a profile. you can also manual enter
elevations or inclinations. The
resulting data can then be saved to
Compass DAT files.
Click here to download a copy of the
program. |
|
Update - 3-10-13 |
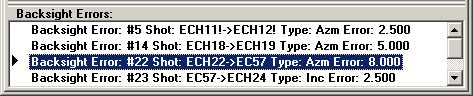
| 1.
Automatic Backsight Validation. The
Editor now supports automatic backsight
validation. As you enter new data into
the Editor, it is constantly testing all
the backsights in the survey to make
sure the agree to within a specified
level of tolerance. All shots that don't
agree are displayed below the main edit
window, which allows you to be aware of
any problems as soon as they are
entered. |
|
|
| Double
clicking on any line in the display will
take you to the line that contains the
error and highlight the appropriate
measurement. |
| 2.
Sketch Editor. Has been improved to
so that it can handle much larger images
without running out of memory. The
editor now stores "undo" and auxiliary
images to disk, rather than in RAM
memory, saving it for direct display and
editing purposes. |
|
Update - 1-28-13 |
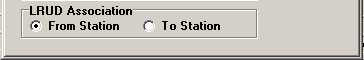
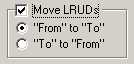
| 1.
LRUD Associations. When Compass
builds passage models it needs to
associate the LRUDs with either the From
Station or the To Station. In the past,
Compass could only do this at the file
level, which meant that every shot in
every survey was handled the same way.
|
| Compass
now has the option of a controlling LRUD
Handling at the Survey Level. In other
words, every Survey can associate the
LRUDs differently. The Editor now allows
you to set the option in the header of
every survey. |
|
| 2.
LRUD Tools. To aid in the process of
converting files to the new system,
Compass has new tools that allow you to
set the LRUD Associations for large
blocks of selected surveys all it once.
|
|
| There are
also new tools that allow you to shift
the LRUDs forward or backwards one shots
for selected surveys. This allows you
fix surveys where the LRUDs were entered
with the wrong station. |
|
|
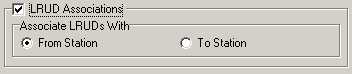
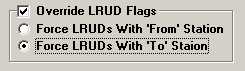
3. Overriding LRUD
Settings. You can override the
survey-level LRUD Flags by changing the
settings in the Project Manager. These
"Override Settings" can be saved either
to the MAK file or as the Project
Manager Defaults. |
|
|
| Update
- 1-1-13 |
|
Mark Fixed Stations.
The Viewer now has the option of Marking
Fixed Geographic stations on the line
plot with a circle and crosshairs. The
Fixed Station Markers appear as light
blue and yellow dots in the picture to
the right.
The feature allows you
to see the relationship between each
fixed stations and the rest of the cave.
This is useful for verifying that survey
errors between fixed stations are
properly adjusted out.
You have complete
control of the size and color of the
Fixed Station Markers. There is also a
new feature that allows you to offset
the position of the Station Labels. This
makes it easier to read the Station Name
when there are other markers and text
near the stations. The example to the
right shows Station Labels offset by
about 5 pixels which provides enough
extra room to see both the Fixed
Stations Marks and the label indicating
which station is the Fixed Location. |
|
|
 |
Tutorials. There are
two new tutorials. The first one walks you
through the process of
Installing Compass on Windows 8. The second
one explains some of the options for
running Compass on a Macintosh. |
|
Update - 11-12-12 |
|
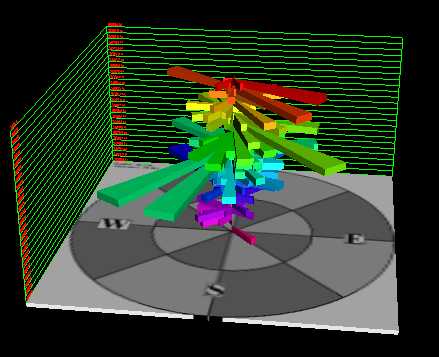
CaveXO now has additional features
that make the 3D Rose Diagram more
useful. You now have the option of
displaying a 3D grid behind the Rose
Diagram that gives the altitude of each
Rose layer. The Grid can be enabled or
disabled at anytime.The Base can also be
removed to the Rose Diagram can be
viewed from below. |
|
|
|
|
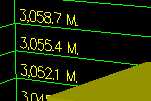
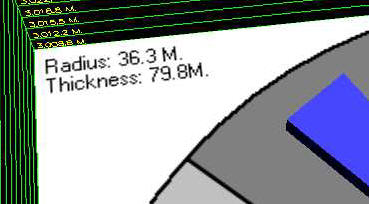
Finally, the Rose base
shows the thickness of each layer in the
Rose Diagram. It also, since the length
each pedal represents the accumulated
length or frequency of passages in the
specified direction, the Base now shows
the radius of the outer circle on the
base. This allows you to estimate the
length of the individual petals. |
|
|
|
Update - 6-10-12 |
|
This update contains several bug fixes and
useful features. Here is a list of the most
important changes: |
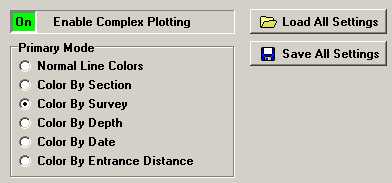
| 1. Saving Complex
Setting. There is now the option to
save all Complex values and settings.
This allows you to build a complex
display and then restore it later can
restore the display without going
through the task of manually setting
each individual option. The option saves
41 Complex Parameters in an XML-type
file so the data can be edited using a
text editor and any one of a number XML
editors. |
 |
|
|
2. Displaying LRUD
Values. You now have the option of
displaying the LRUD distance values on
screen in association with the Passage
Wall Marking feature. This is helpful
for drawing maps and passage-wall
tracing operations. It saves having to
look in the survey book for the values. |
|
|
3. Exporting LRUD Values. The Custom Export
option in the Statistics section now has the
option of exporting the LRUD values for each
station.
4. Misc. Improvements. The processing of
LRUDs has been improved so that erroneous values
aren't propagated. LRUDs can now be exported
along with other values in the Custom Export
option. The Declination Calculation options have
been simplified and clarified so they are easier
to use and more logical. |
|
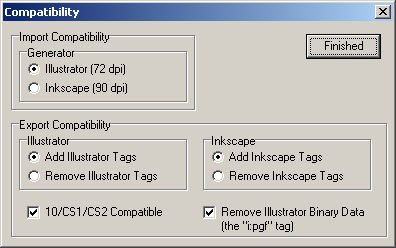
SVG Exporter Major Update
- 3-19-11 |
| There is
a major new release of the SVG
Exporter that contains many new
features that help you deal with
compatibility and corruption issues when
working with SVG files. |
|
The program now handles
problems caused by the accidentally
deletion and corruption of key layers
that can prevent a file from being
loaded or processed. It also handles
changes made by Adobe Illustrator that
can make the file unreadable by Inkscape
and vice versa. The program can replace
missing tags and layers and can remove
extraneous tags that can cause
compatibility problems.
Click here for a complete
description of the Compatibility issues
and improvements. |
|
|
|
Major Update - 3-20-10 |
This is a major
update for Compass. Here is a description of the
newest features.
I. Cartography Tools.
The Compass Cartography Tools are a new set of tools that helps you
create presentation quality digital survey map from Compass files. The
tool kit consists of the two basic pieces: the Sketch Map Editor and the
SVG Exporter/Merge/Morph (round-trip) Tool. To download these programs,
go to the Compass Download Page.
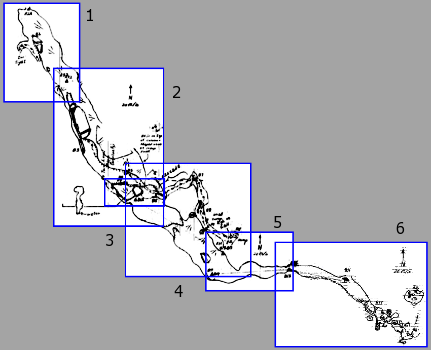
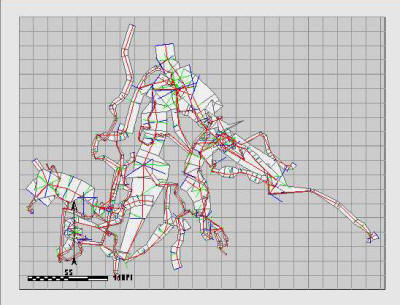
| A. Sketch Map Editor.
The Sketch Map Editor helps you to take the
sketch maps you generate in the cave and use them as the basis
for your finished maps. The Editor allows you to take a scanned
bitmap image and edit it to remove flaws, align it to north,
scale it to a standard scale, and trim the image to size. It
also allows you to merge multiple images into single image,
using transparency to precisely align the passages. Finally, it
allows you to warp or "morph" the image so station positions in
the sketch map, precisely match the positions in the cave data. |
| Once a combined image has been created
in the Editor, the image can be loaded into a drawing program for
tracing. Having a precisely aligned, single image makes producing a map
much quicker and easier because you don't have to load and align
individual images. Also, since the image has been warped to match the
survey shots, you don't have to constantly shift the image as you are
tracing.
To guide you through the process of using the Sketch Map
Editor, I have created a detailed tutorial that will walk you through
the process:
Click here to view the
Sketch Map Editor
Tutorial. |
 |
| |
| B.
SVG Exporter.
SVG is a widely used file format for
drawing programs. Because it is so widely used, it is an ideal
format for exporting cave data. For example, programs like Adobe
Illustrator and Corel Draw will read and write these file. Even
more important there are
Freeware programs like Inkscape that can
read and write SVG files. |
| The SVG Exporter
allows you to export cave survey data as SVG files. The SVG
files contain a complete cave map on multiple "layers" that
include stations, shots, passages, LRUD marks, a grid, a north
arrow, a scale bar, a frame, and a colored background. The
exported map also contains empty layers into which you can place
your hand-drawn passage walls, floor details, a legend, notes,
etc. This allows you to use the SVG map as the starting point
for a high quality, finished digital map. |
|
For a complete
tutorial on using the SVG Exporter
click here.
|
| C. Converting And Adopting.
The SVG Converter has special tools that allow
you to use maps that were generated with different drawing
programs. For example, Inkscape has different layering system
than Adobe Illustrator so Illustrator layers do not show up in
Inkscape. In addition, programs like the
Compass SVG Exporter and Walls, require certain layers to be in
place before they can be merged, morphed, or round tripped. The
SVG Exporter can add these layers to any SVG file, whether it
was originally generated by cave survey program or not. As a
result, the SVG Exporter can "adopt" an existing cave map even
if it wasn't originally generated by Compass (or Walls.) Once
the map has been "adopted," it can be treated like just like a
map that was generated by Compass or Walls. In other words, It
can be merged, morphed or round tripped.
Click here for a
detailed explanation of the Converting and
Adopting Process. |
| D. Using
Inkscape. One of the big advantages of
SVG is the fact that there are several Freeware drawing programs
that support it. One of the best is Inkscape, a drawing program
that is very similar to Adobe Illustrator. Since
Illustrator can costs hundreds of dollars, Inkscape is a perfect
alternative for cavers on a budget.
Because Inkscape is free and works well for cave
mapping, I have developed the Exporter to be compatible with
Inkscape. (It will also work fine with other programs such as
Illustrator.)
Because all sophisticated drawing programs
require a lot work to learn, I have designed a detail tutorial
on making cave maps using Compass and Inkscape. Here is a link
to the
Compass Inkscape Tutorial.
|
 |
| F. Merge/Morph Tool
(Round-tripping). The final tool
solves one of the biggest problems for cave cartographers:
updating an existing map as the data changes. For example, if
you survey a new passage, the new data will need to be added to
the existing map. If the passage is extensive, you may have to
reduce the scale, use bigger paper or even rotate the cave so
everything fits on a piece of paper. |
| In addition to adding new data,
you may correct errors in the data or improve the loop closure.
When this happens, all the shots in the cave may move. This may
change the angle that shots come together and passage intersect.
When this happens all the carefully drawn wall details will need
to be moved, stretched, compressed or warped to match the new
shot position.
Normally these kinds of changes would require lots of
painful and tedious hand adjusting. If the changes are extensive enough,
it may even require starting a new map from scratch.
The image to the right shows a section of a cave
map before a 30-degree correction is made at Station B7. |
 |
| The Merge/Morph tool allows any
SVG-based map to be adjusted even after passage lines have been
drawn, floor detail placed and the map has been finished. It
allows you to move, rotate and scale all the hand-drawn elements
of a finished cave map, so the map can be completely
re-configured without losing any of the hand-work in the map.
The tool will also smoothly warp (morph) the passage walls,
floor details and other hand-drawn elements so they track
changes in the shot positions. For example, if the angle at a
passage junction becomes tighter, the passage walls will be
compressed to fit and still maintain the same relative distances
from the shot lines.
|
 |
| This image show how
the passage and details are warped to accommodate a 30 degree
change at B7. You will notice how the passage walls and details
are stretched right at the corner and the rest of the passage is
only moved and rotated, with no warping. |
| Click here for a
complete tutorial on using
the SVG Exporter's Merge/Morph Tools |
|
| III. Station
Coordinates: You now have the option of
displaying station coordinates next to each station. The coordinates
can be displayed as UTM (Feet or Meters) or Longitude and Latitude
in degrees or degrees minutes and seconds. |
 |
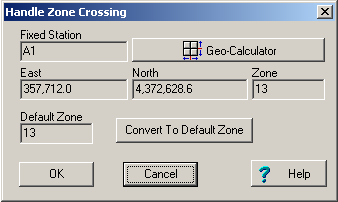
| IV. Zone Crossing.
In some rare instances, you may have two or more caves that aren't
in the same UTM zones. This usually occurs when you have a cave
system close to the Zone boundary.
Compass now allows you to handle that situation by
extending the base zone so it encompasses the caves beyond it. This
is standard practices in cartography. |
 |
| V. Latest Magnetic
Declination Models. This version of Compass has the newest
magnetic declination models covering the years 2010 through 2015. |
|
|
7-20-08 Update |
| Google Earth KML
File Export.
Compass now supports the
export of cave data to Google Earth in
the form of KML files. This allows you
to place the passage foot print of your
favorite cave on the surface terrain and
display it in Google Earth. |
|
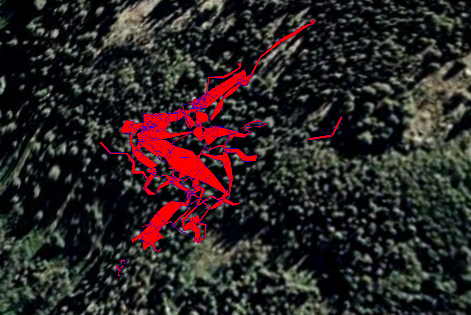 |
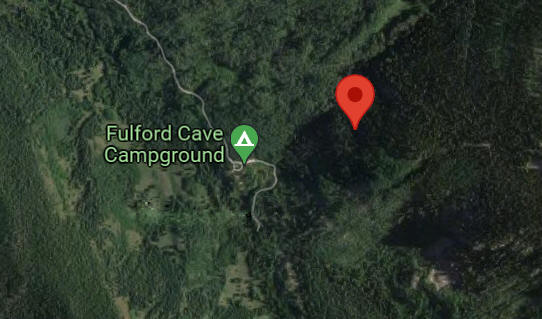
The image to the above
shows Fulford Cave superimposed on the
terrain around the cave. Exporting KML
files makes it very easy to view the
relationship between the cave and the
surrounding terrain. It also allows you
to share the latest cave data with
project members without the delay of
drafting maps. This is perfect for
surveying and exploration projects.
KML files can be embedded in web pages
to allow other people to view the cave.
For example, if you have Google Earth
installed on your computer, click on
either of these two links to view some
Colorado Caves:
|
|
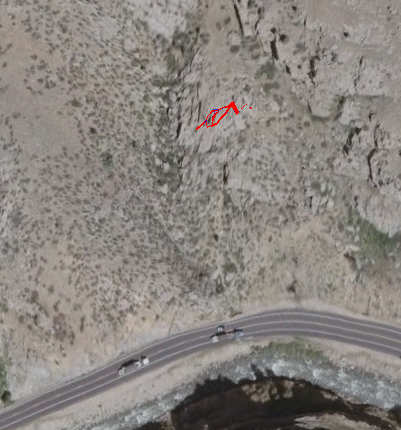
The image to the below
shows the image of another Colorado Cave
called the "Fault Caves". These caves
are associated with tectonic faulting
along the Front Range of Colorado and
viewing them in Google Earth makes it
possible to see how the caves relate to
the geology. |
|
 |
|
The Compass KML
exporter gives you complete control over
the Fill Color, the Outline Color and
the transparency of the passages. By
making the passage partially
transparent, you can see the details of
the terrain through the overlay. |
|
|
11-17-07 Update |
| There are now
printable manuals available for all the Compass
programs. They are in the Microsoft Word "doc"
format and can printed from Word Pad which comes
free with every copy of Windows. There are more
than 270 pages of documentation and you can
download copies of the manuals by
clicking here.
|
|
8-19-07 Update
|
| With the release
of Windows Vista earlier this year, we are
entering a new phase in the development of PC.
Unlike some previous versions of Windows, Vista
makes some radical changes in the way programs
work under the operating system. All Compass
programs work fine with Windows Vista with one
exception:
CaveXO.
CaveX uses DirectX "Retained Mode" to display
cave passages. Vista doesn't support "DirectX
Retained Mode" and so CaveX will not run
properly under Vista. To deal with this problem,
I have created a new version that uses OpenGL to
render the 3D passage models. OpenGL is widely
available across many computer platforms and
most graphic cards provide drivers for OpenGL
that will work under virtually any version of
Windows. The new version is called CaveXO and
can be downloaded by
clicking here.
The latest version of CaveXO has most of the
features of CaveX. It also has Vista-compatible
help files. The only features that aren't
available are Joystick control and the ability
to load and save X files. These featues will be
added over the next few months
Help Files.
The help files that were shipped with previous
versions Compass don't work with Vista. The
latest version of Compass now has all the help
file converted to a Vista-compatible format. If
you don't have the latest version, you can
download it by clicking
here.
|
|
New Release on
6-1-07 - Over 26 Combined Changes |
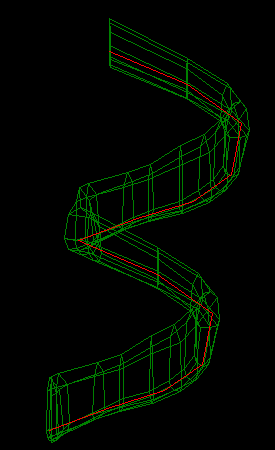
| Unfolded
Profiles or Developed Profiles |
|
Normally, when
you view a cave in profile, some
parts of the passage will run
directly toward or away from the
screen. In this case, the
passage will appear to be just a
short segment even though it
could be thousand of meters
long. You could rotate the cave
to get a better view of the
passage, but, at the same time
you are likely to rotate other
passages so their length becomes
invisible. |
|
 |
|
The cave passage
to the right is a good example.
Basically, the passages form a
descending spiral. Viewing it in
profile, you cannot see three
passage segments that pass
directly toward or away from the
screen. Because of the spiral
shape, no matter how you rotate
cave, some part of the cave will
be hidden.
To solve this
problem, Compass has a feature
called “Developed Profiles” or
“Unfolded Profiles.” The program
basically unfolds or flattens
out the cave so you can see the
full length of every passage.
This will distort some parts of
the cave, but it will allow you
to see the full lenght of every
passage. |
|
The image to the
right shows the same passage as
an Unfolded Profile. You can now
see a full profile of every
shot. Before, you could not tell
anything about the slope of the
hidden shots. With the new
image, you can see the full
length of every shot and see
that cave slopes evenly down the
entire spiral. (Note, the image
has been scaled down so the
unfolded length will fit on the
web page.) |
|
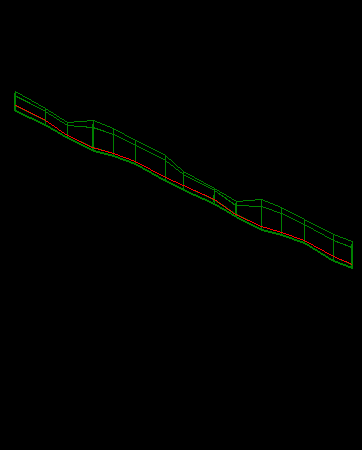
|
|
Compass gives
you several options for
controlling the way the profiles
are produced. For example,
passages can be flatten using
the "nearest-angle" method or
the "fixed-angle-method." You
can also control the angle of
the plane to which the cave is
flattened. Unfolded profiles are
useful for maps of deep, winding
pits where you want to display
as much detail as possible. |
|
|
Entrance Distance |
|
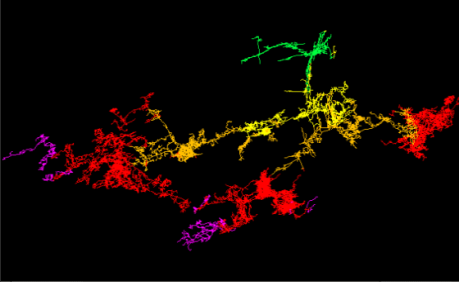 |
| This new option
allows you to color the passage
according to the distance from the
entrance. This is not the straight line
distance, but the actual travel distance
required to reach a certain point in the
cave. You have complete control over the
colors and how much distance is covered
by an individual color. This allows you
to setup zone maps of the distance from
the entrance that are perfect for
expedition planning. For example, the
map above shows the entrance distance in
Lechuguilla Cave. Each color is
represent 1/2 mile distance from the
entrance. In this picture the green zone
would be appropriate for day trips,
whereas the purple zone would probably
require overnight camping. |
|
|
Italian Tutorial |
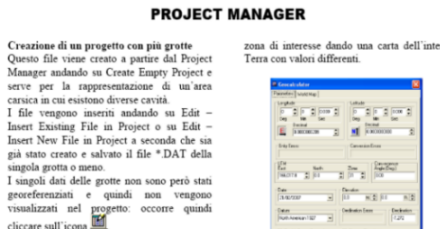
|
| Thanks to Andrea
Maconi, we have a very nice
Compass tutorial in Italian.
The tutorial is a well produced, PDF
file complete with screen shots. It
should make it a lot easier for Italian
cavers to learn and use Compass. |
|
| Precise
Distance Displays |
|
You can also displays the
precise entrance distance at each survey
station. Again, this is not the
straight-line distance, but the travel
distance through the passages to get to
the station. Like the Color-by-Distance,
it is useful for estimating the
difficulty of reach a certain point in
the cave. |
|
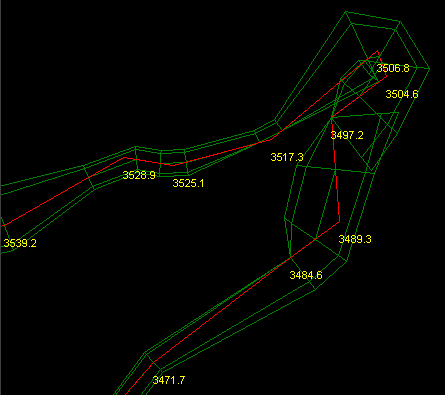 |
| It is also
useful for orienting yourself in the
cave by finding the direction back to
the entrance. You have the choice of
either meters or feet and the size, font
and color of the distance-labels is
configurable. |
|
| Displaying Shot
Azimuth, Inclination and Length |
|
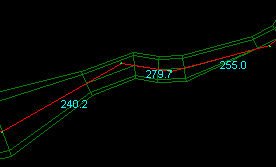 |
| You now have
the option of displaying the Azimuth,
Inclination and Length of each shot. The
image to the right shows a display of
the Azimuth for each shot. Again, you
have the choice of fonts, size and
color. |
|
| Block Modify
Options |
|
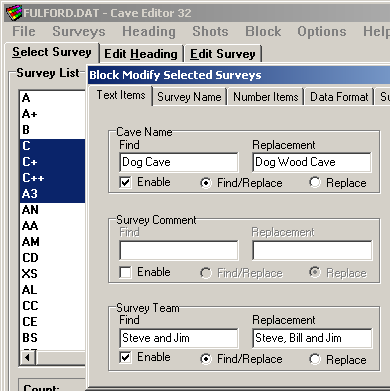 |
|
The
Block Modify Option in Compass
allows you to make complex changes to
survey data across a range of shots and
surveys. This is useful repairing
problems where large blocks of data were
entered incorrectly. It is also useful
for reorganizing the data. Text items
can be selectively modified. Station
names can be selectively prefixed or
post-fixed. Numerical items can be
modified. Shot flags can be selectively
set or cleared. All these options can
save hundreds of hours of manual labor. |
|
| Fit Cave to
Screen |
|
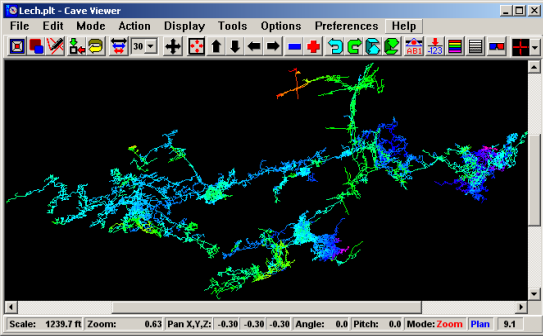 |
| The Compass Viewer
now has a special tool that will
automatically fit the cave display to
the current window size. This makes it
easy to view the whole when you have
resized the window to take up only part
of the screen. This is particularly
useful when you are looking at several
caves at the same time. |
|
|
More
Recently Added Features >> |
|
|
|
|
|
| Sponsored Links |
|
|
| Sponsored Links |
|
|
| Sponsored
Links |
|
|
| Sponsored Links |
|
|
|