|
COMPASS For
Windows |
|
|
|
Getting COMPASS
|
|
|
|
Download/Install Issues
|
|
|
|
Registration
Information |
|
|
|
Auxiliary Tools/Information |
|
|
|
Tutorials - (New) |
|
|
| Links |
|
|
|
Documents/White Papers |
|
|
|
COMPASS For DOS |
|
|
|
MISC. |
|
|
|
|
|
|
|
|
3D ROSE DIAGRAMS |
|
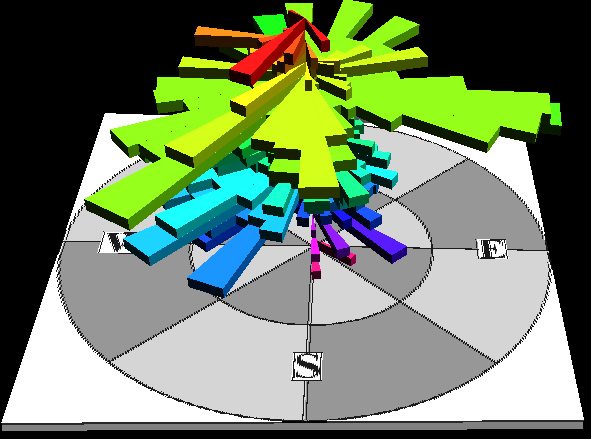
True 3D Rose Diagrams. CaveX is capable
of producing true 3D Rose Diagrams. These diagrams show both passage orientation
and depth. This allows you to see passage trends that only exit at certain
depths. In the image above, you can see a strong eastward trend that is only
manifest in the middle level of the cave. |
 |
|
Passage Orientation. Here is a rose diagram from Fulford Cave. Fulford
has two major passage trends, southwest and east-southeast. You can clearly see
in this diagram that the eastern trend is confined to the upper parts of the
cave. In the deeper parts of the cave the trend is missing. |
 |
|
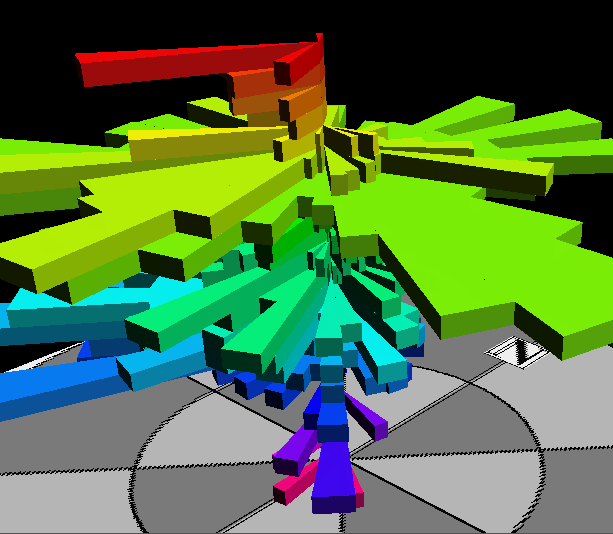
Zoomed View of 3D Rose.
These images can be zoomed, panned and rotated
in real time, which allows you analyze specific
passage trends in detail
The picture above shows the same rose diagram
zooming into the southeastern-trend area. Here
you can see that the east-southeast trend quickly disappears but there is a pure
southeast trend that appears in the deepest parts of the cave. This kind of
detailed analysis is impossible with ordinary 2D Rose diagrams. |
|
|
|
| Sponsored Links |
|
|
| Sponsored Links |
|
|
| Sponsored
Links |
|
|
| Sponsored Links |
|
|
|