COMPASS Blunder Location
When you survey a cave there are always some errors in the measurements.
Most of the time, these errors are small and random. Occasionally, errors
occur which are due to major mistakes in the surveying process. For example,
you might read the wrong end of the compass needle or write down the wrong
numbers in the survey book. These kinds of errors are called blunders. Blunders
are fairly common occurrences in cave surveying. For example, in caves like
Wind and Lechuguilla, there is one blunder for every 40 to 80 shots. As a
result, blunders are a big problem in cave surveying.
The COMPASS compiler has the ability to locate loops which have blunders.
In addition, the compiler can pinpoint the individual shots and measurements
that have caused the blunder. The program does this by first locating loops
with large errors. After it finds loops with large errors, the program makes
a test adjustment of each shot in the loop trying to fix the error. The
adjustment that best fixes the error, is the best candidate for being the
blunder.
To give you an idea of how the blunder location process works, here some
screens showing the actual blunder location process for a portion of Lechuguilla
Cave:

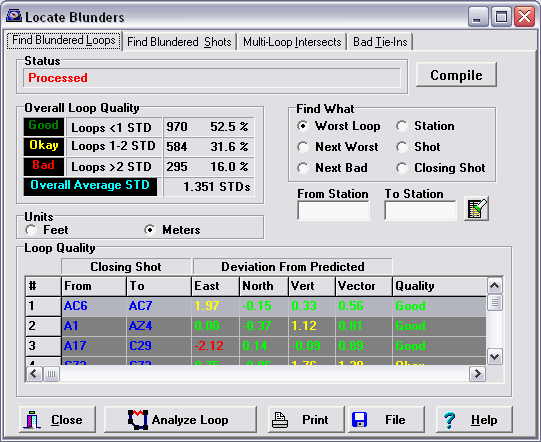
This screen displays a list of loops and loop errors for the cave. The program
makes a predication for each loop about how large the error should be if
the errors are random. This prediction is called the "standard deviation"
for that loop. Loops that have errors that are more than two times the prediction
are considered bad. As you can see, the loops are rated as being "good",
"okay" and "bad." They are also color coded to make it easy to see the good
and bad loops.
At the top of the screen is summary for all loops in the cave, showing the
percentage of good, okay and bad loops. This is useful for evaluating the
overall quality of all the surveys in a cave. At the bottom of the screen
is a list of loops and errors. As you can see, one of the loops is highlighted.
This loop has an error of five standard deviations. This means that the loop
had errors that were five times the predicted error.
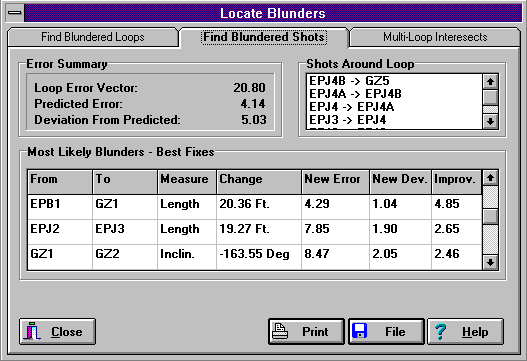
The next screen shows a detailed analysis of the is loop:

The program attempts to correct the error by adjusting each measurement in
each shot, one-at-a-time. It saves the best attempts. This screen lists the
most successful adjustments. As you can see, the best adjustment was made
to shot EPB1-GZ1. By changing the length by about 20 feet, the program was
able to improve the standard deviation to around one. This makes this shot
a very good blunder candidate.
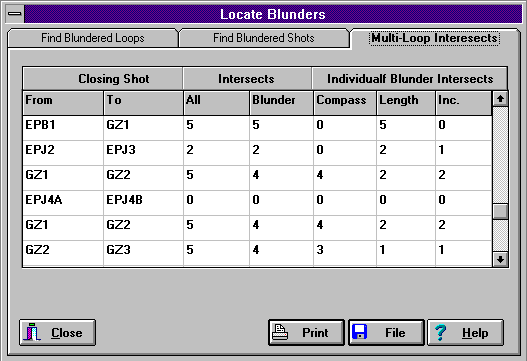
The final screen shows a method the program uses to help verify the blunder:

Sometimes, a shot will be a part of more than one loop. If a shot is a blunder,
then it should show up as a blunder in every loop it is a part of. This screen
shows a count of all the loops a shot is in and a count of all the loops
it appears to be a blunder in. As you can see the shot EPB1-GZ1 is a part
of five different loops and it shows up as a blunder in all five. This means
that the shot very likely blundered. On the other hand, the shot GZ1-GZ2
is a part of five different loops, but it only appears blundered in four
of them. This pretty much eliminates the shot as a good blunder candidate.
Locating Bad-Tie-Ins

One of the most common types of blunders occur when a shot is tied to the
wrong station. This can happen through typos, misplaced stations in the cave
and renaming stations after the survey is complete. When shot has been mis-tied,
it result in loop errors hundreds of feet long.
COMPASS locates bad tie-ins by breaking the loop at every station and trying
to find a better tie-in. It then keeps a list of best new ties.
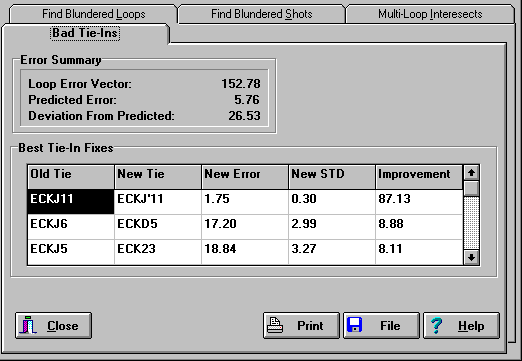
To give you a real-world example of locating a bad tie-in, the image above
shows a loop in Nearwest part of Lechuguilla Cave. It has 152 foot loop error.
If the shot to EKCJ11 is reconnected to EKCJ'11 the loop error goes down
to 1.75 feet., a dramatic improvement! It is obvious the similarity between
EKCJ'11 and EKCJ11 has caused this error.
Using the new feature, obvious blunders jump out at you. For example, here
are some obvious examples of mis-ties in the Lechuguilla data set:
        OLD TIE    NEW TIE    OLD ERROR    NEW ERROR

             K6       K6!    174.64 ft.      6.19 ft.
         ECKJ11   ECKJ'11    152.78 ft.      1.75 ft.
           BNM4      DNM4    127.52 ft.      3.44 ft.
          EY52a     EY52A     87.47 ft.      5.39 ft.
As you can see, all of these mis-ties are due to obvious topographical or
clerical errors. The program makes it easy to find this type of error.
|

