|
COMPASS For
Windows |
|
|
|
Getting COMPASS
|
|
|
|
Download/Install Issues
|
|
|
|
Registration
Information |
|
|
|
Auxiliary Tools/Information |
|
|
|
Tutorials - (New) |
|
|
| Links |
|
|
|
Documents/White Papers |
|
|
|
COMPASS For DOS |
|
|
|
MISC. |
|
|
|
|
|
|
|
|
|
|
Adding Passage
Details |
| IX. Adding Details.
The next step in the
process is to add passage details. This include things like symbolic
markers for pits, domes, ledges, passage slope, formations etc. Since
the symbol used for cave maps vary from one part of the world to
another, I will be using the symbols found on this particular sketch
map. However, the symbols are similar world-wide and the same techniques
used here can be used to draw any other symbol.The
first thing you need to do is decide if the details should be "morphed"
if the shots change as a result of correcting an error or closing new
loop. |
| A. Adding Morph-able Details.
Certain
aspects of the passage details should be morphed or reshaped when the
survey data changes. For example, the shape of a "drop-off" would need
to change if the shape of the passage changes as a result of error
corrections in the survey data. For this reason, there is specific Detail Layer for
morph-able items. Anything that you think needs to be reshaped should be
put here. |
| To add morph-able details,
you should begin by making the "cmp_Tracing" layer and the "cmp_Sketchmap"
layer that contains your sketch map visible. You should also turn
off the "w2d_mask" layer so it doesn't obscure the sketch map. |
| Next, select the
"w2d_Detail" layer from the Layers List on the right side of the Inkscape window. Next select the "w2d_Detail_shp" sub-menu item.
From this point on, all the new items you draw will be placed in this
layer. |

|
| 1. Drawing A Drop-Off Symbol. We'll start by drawing a simple drop-off
symbol. Since the drop-off symbol is similar to other passage-detail
symbols, it will give the basic knowledge necessary to draw other
symbols. |
| a. Drawing The Baseline. Begin by
selecting the Bezier Tool. Then move to the area of the map you want to
draw the drop-off symbol. |
 |
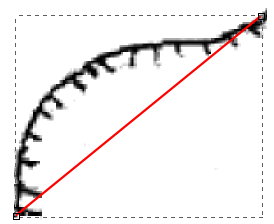
| Now click once with the left mouse button
where the drop-off begins. Next, move the cursor to where the
drop-off should end and click once with the
right mouse cursor. A line connecting the two point should appear.
If the drop-off symbol is longer, with multiple curves,
you would probably want to draw multiple lines by clicking once
everywhere that the line changes direction. In this case we will just to
a simple example. |
|
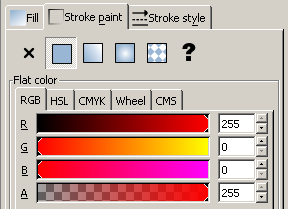
Since the sketch map is usually in black, it is useful to
change the line color to a contrasting color. To do this, select the
"Object -> Fill and Stroke" option from the menu bar. Next, select the
"Stroke paint" page. Make sure the "Flat Color" button is down and then
adjust the color with the sliders halfway down the page. |
|
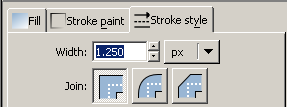
| If the line isn't as thick
as you want, select "Stroke Style" page and adjust
the Width until you are happy the line thickness.
|
|
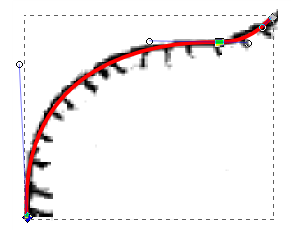
| Now we are going to curve the line so it
matches the curve of the drop-off. You begin by selecting the "Node
Tool" on the left-hand tool bar. |
 |
| Next, go to the middle of
the line and click with the left mouse then drag it in the direction you want it to curve.
If the curve complex, you can add additional node points, by double
clicking on the line. In this case, I needed to add an additional point
to make the line follow the exact curve on the sketch map
Remember, you can create complex smooth lines using the
techniques you learned in the section on
Tracing. . |
|
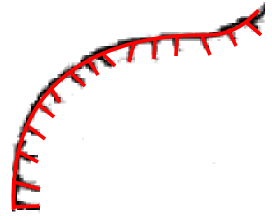
| b. Adding Hash marks. In the next
step, we'll add marks indicating the direction of the drop off. |
| Switch back to Bezier Tool. |
 |
| Move the mouse cursor to the
point on the line where the first hash-mark begins and click once with the left mouse button.
Now move the mouse to where you want the
line to end and right click. A short line will appear. Do this
repeatedly along the base line until you have all the lines you want. It
may be helpful to zoom in so you have more control over your lines. |
|
| If your lines weren't
positioned right or weren't long enough, you can adjust them using the
Node Tool. Just drag the node to the proper position and the line will
stretch to match. |
 |
| c. Grouping. The next step is to
group all the lines together. This will allow you to move the object and
reposition it as a whole. You begin this process by selecting the
Node Tool. |
 |
| Next click on any of the lines you just
created. This will select the line. A dotted box will appear around the
line. Now hold down the Left Shift Key and
click on another line. This will make both lines selected and both
should have dotted-boxes around them. Do this for
all the lines in the drop-off symbol. Now select the "Object -> Group" option from the
menu bar. |
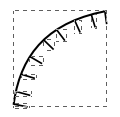 |
| All the separate dotted lines should
disappear and the whole object should be enclosed in one single box or
dotted lines. |
| 2. Drawing A Stream Flow Symbol. As another example of
how to produce details, we'll draw the typical arrow-symbol that shows
the direction of water flow. |
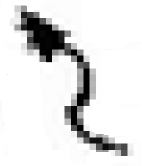
a. Draw Base Line. On a sketch-map, the water-flow symbol
looks like the image to the right.
| We'll start by using the Bezier
Tool. |
 |
Move the mouse cursor to the tail or non-arrow end of
the symbol and click once with the left mouse button.
Next, click several places all the course of the line until you get to
the tip of the arrow. At the tip, right click once. This will finish the
line |
|
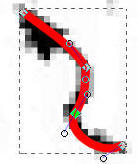
| b. Smooth Line.
In this example, I
used four clicks to draw the line, so there are four nodes. The next
step is to smooth the line so it tracks the original drawing. You do
this by dragging the line so it curves and by adjusting the control
points. These are same techniques you learned in the section on
Tracing. |
|
| c. Place Arrowhead. The last step
is to put an arrowhead on the end of the line. To do this, select
the "Object -> Fill and Stroke" option from the menu bar. Select the
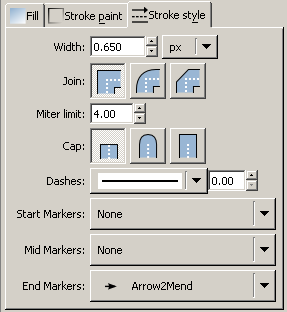
"Stroke Style" page and press the "End Markers" button. A list of "ends"
for the line will appear. Choose "Arrow2Mend" option. An arrow will
appear at the end of the line. The arrow will point in the direction
set by the last two nodes on the line. If the arrow doesn't point in the
direction you want, try adjusting the position of the nodes or deleting
nodes. |
 |
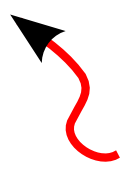
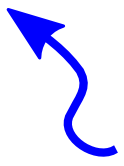
| d. Set Arrowhead Color. The
arrowhead color defaults to black. If your line will be black, then no
further adjustments are needed. If the line is another color then you
will need to set the arrowhead color. To do this, select the
"Extensions -> Modify Path -> Color markers to Match Stroke" option from
the menu bar. Note: the water-course symbols must be "Ungrouped" for this option to
work. |
|
 |
| e. Reusing Details.
Any previously created
detail be reused, which can save you a lot of drawing time. For example,
the stream flow arrows can be reused so you can quickly lay down new
arrows. |
| You can reuse any object by selecting it
with the "Selection" tool, then choosing the "Edit -> Copy" option from
the menu bar. |
 |
| This saves a copy of the item on the clipboard.
You can now scroll to any place on the image and use the "Edit -> Paste"
option to place the item. |
| After you paste, the item will probably not
be in the right position or orientation. You can adjust the position
using the "Select" tool by clicking on the object and dragging |
 |
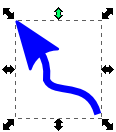
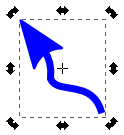
| You can also scale and
rotate any detail item. When you first click on an object, small
arrows will appear on the sides and at the corners. Dragging these arrow
will scale the object to any size. This works well for scaling things
like these stream flow arrows to match those drawn on the sketch-map. |
 |
| Likewise, you can also rotate the object by
clicking on the object a second time. This will display curved arrows at
the corners and sides. Dragging the corner arrows will rotate the
object. This works well for rotating things like the stream flow arrows
to match those drawn on the sketch map. |
|
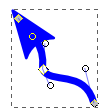
| You can also reshape the object by clicking
and dragging the nodes in the object by using the "node select" tool.
|
 |
| If you click on one of the nodes, you can drag
it to a new location and
reposition part of the line. Dragging the line itself will allow you to
change the shape of the line. Dragging the control points gives you very
precise control of the shape of the adjacent line. Finally, you can use
the control point for last nod, to rotate the arrowhead independently
from rest of the line |
|
| f. Final Coloring.
I like to use several different
colors when I'm working on tracing the passages and filling in
details because it makes it easier to distinguish your lines from the
sketch-map image. However, when you have finished, you usually want to
change all the colors to black. This is easy to do and If you have been
grouping lines together, it will go even quicker. |
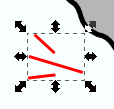
| You will typically want to use the
selection tool because it will select all items in a group at once.
|
 |
| When you click on the a group of items, a
box will appear around the item indicting that they have been selected
as a group. On the menu bar select the "Object -> Fill and Stroke"
option. |
 |
| Next, select the "Stroke Paint" page.
Depending on how the group was assembled, you the [?] question mark
button may be down. If so, press the "Flat Paint" button
(second from the left.) |

|
| Now select the color you want to use for
the group. At this point it will typically be black. Just move the
slider toward the color you want. For example, in the example to the
right, the color selected is red. On the "R" slider, you can see that
the colors grade from red on the right to black on the left. Just slide
that control to the left, and the color will change to black. |

|
| B. Non-Morphable Details. So far, we have only looked at
details that should move and be warped as the passages shift when the
survey data is changed. There are other items that need to be moved but
should not be warped. 1. Ceiling Height Circles. A good example of this are the small circles used
to specify ceiling height. We want them to move, but warping them would
cause the circles to change to ovals. To give you an idea of how to deal
with non-morphable details, we'll place ceiling heights on our tutorial the map. |
| Begin by selecting the "w2d_Detail_sym" section. All items in this
section will be moved but not warped. Make sure the layer is visible,
unlocked and selected (highlighted.) |

|
| a. Heights Layer.
We could just put the
height items in the w2d_Detail_sym layer, but to keep things well organized, we are going to add
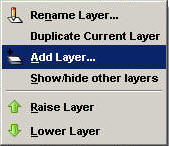
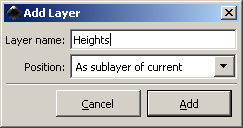
a new sub layer for the title. Right click on the w2d_Detail_sym layer and
select the "Add Layer" option. |
|
| This will bring up the "Add Layer" dialog.
Set the Layer Name to "Heights" and set the Position option to "As sublayer of current." Press the "Add" button when you are finished.
This will add a new layer name "Heights" to the layer list. The new
layer will be under the "w2d_Detail_sym" layer. |
|
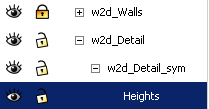
| Now make sure the Heights layer is selected, unlocked and visible.
Also, make sure all the parent layers w2d_Detail_sym and w2d_Detail are
visible and unlocked. |
|
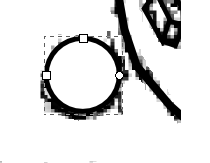
| b. Height Circles. The next step is
to make a circle
where the height symbol should appear. Begin by selecting the "Circle" Tool
from the Tool Bar on the left side. |
 |
|
Now click on the spot where you want to place the
height circle, hold down the Control-Key and drag diagonally with the
mouse. Keep dragging until you have a circle of the proper size. |
|
| i. Adjusting the Circle. At this
point you may find that the circle has the wrong colors and border
thickness. To fix this, select the "Object -> Fill and Stroke" option
from the menu bar. This will
bring up the "Fill and Stroke" options in the right hand panel
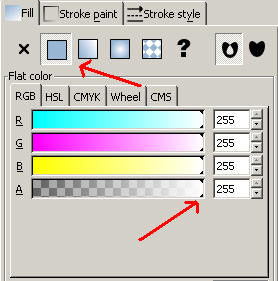
ii. Fill
Color. First we will be setting the color that fills the center of
the circle. Start by selecting the "Fill" page. Make sure the "Flat
Color" button is down. You will probably be using a white background
color, so adjust the color to white. |
|
| iii. Border Color. Next, select the
"Stroke Paint" page. Again, make sure the "Flat Color" button is pushed.
Next, use the color selection tools to pick a color. You will probably be using
black so adjust the color to black.
|

|
| iv. Border Style.
Finally, we are
going to set the border line thickness. I usually use a thickness of
0.75 pixel, but choose a thickness that looks pleasing to you. |

|
| c. Adding Text. The next step is to add the
height number to the circle. Select the "Text Tool" from the tool bar on
the left. |
 |
| First we need to choose a default font and font size. Select the
"Text -> Text and Font" option from the menu bar. |
|
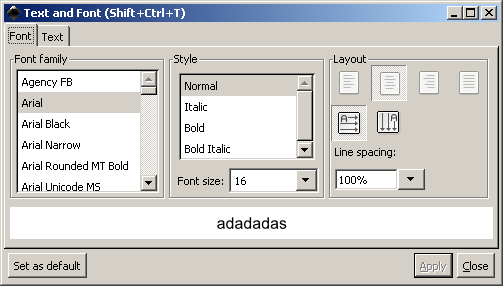 |
| Choose a Font Family and a Font Size. For the ceiling heights I'm
using Arial and an 8 point font. Set the layout to "Center Lines" and
press "Set as Default" button. The font and size you selected
will now be the default whenever you insert text in the map. |
| Click in the center of the circle. This will place a
vertical cursor on screen. Just type the numbers you want. If the
numbers are off center, use the Selection Tools to reposition them |
 |
|
If you are not happy with the font face or size, you can change value
using the options on the top tool bar. You can also adjust the circle
size to match the font you are using. |
|
 |
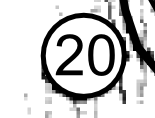
| You should now group the circle and the text together. First select
the circle. Then, holding down the Shift key, select the text. Finally,
hit Control-G. This will group the two items together.
Since you will probably be placing lots of ceiling height symbols,
you can speed up the process by selecting one of the completed items and
hitting Control-C to copy it to the clipboard. Now you can use Control-V
paste a copy anywhere you want. Then all you have to do is change the
number. The fonts and circle sizes will automatically be uniform for all
your ceiling height symbols.. |
|
| C. Finishing Up Details. The process of drawing
the details usually proceeds from one end of the passage to the other,
drawing each detail item one at a time and then grouping them.
There are a wide range of objects that can be drawn in the "Details"
section. The techniques described above should give you ideas about how
to draw various items. Inkscape has lots of tools and it took me a while
to discover the basic ones that I needed to draw everything. You may
discover better techniques and other tricks that make this process
easier and quicker. Studying the Inkscape documents and searching the
internet will solve just about any problem you may have. |
|
|
|
|
|
|
| Sponsored Links |
|
|
| Sponsored Links |
|
|
| Sponsored
Links |
|
|
| Sponsored Links |
|
|
|

