|
COMPASS For
Windows |
|
|
|
Getting COMPASS
|
|
|
|
Download/Install Issues
|
|
|
|
Registration
Information |
|
|
|
Auxiliary Tools/Information |
|
|
|
Tutorials - (New) |
|
|
| Links |
|
|
|
Documents/White Papers |
|
|
|
COMPASS For DOS |
|
|
|
MISC. |
|
|
|
|
|
|
|
|
|
|
Editing |
| II. Editing Your Sketches.
At this point, we will edit your
sketch images so they have a consistent scale, rotation and size. |
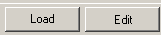
| A. Loading
An Image. The B-Survey in Fulford
Cave has six
sketch-maps associated with it.We'll begin by loading the first image
into memory. To do this, press the Load button and select the
scanned image file. The image you've selected will appear in the main window. |
 |
|
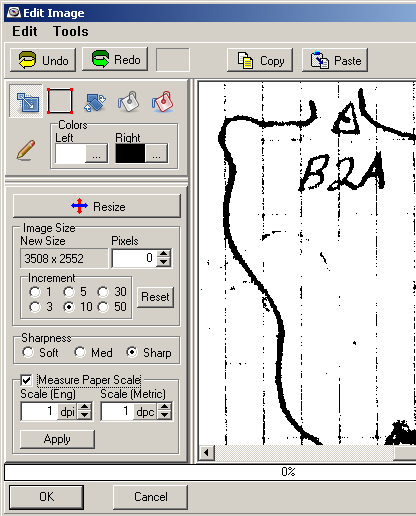
B. The Editing Tool. Next, we'll use
the Edit Tool to do the scaling, rotation and trimming.
Just press the Edit Button and the Image Editor will appear. It should
look something like picture to the below. |
C. Scaling. The first
step in the process is to set the Paper Scale of the image so it will be easy to handle.
The Paper Scale is different from the Cave Scale. It
represents the number dots or pixels that corresponds to an inch or a
centimeter on the paper. We will deal with Cave Scale later
Generally speaking, I like to use a resolution of 100 dot/Inch (dpi)
or 40 dots/centimeter. Other maps may require different scales, so
you may need to experiment with your data to find what works best.
|
|
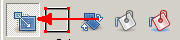
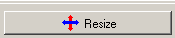
| Begin by pressing the "Resize" button at
the top of the left-hand panel. The scaling tools will appear at the bottom
of the panel. |
|
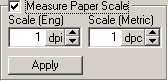
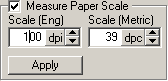
| At the bottom of the panel, enable the
"Measure Scale" option. We'll use this tool to measure the pixel-scale
of the scanned image. To do
this you will need to find the markings on your image that indicate an
inch or a centimeter. |
|
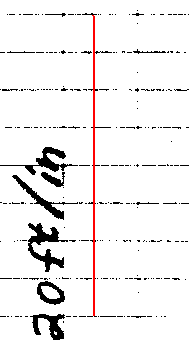
| Scroll to a point on your
image where the grid-lines or
scale marks appear. Click the left mouse button on
first mark or line and then drag the mouse to the ending mark and release
it. You should see a red line appear that follows your mouse movements.
The survey book used for this Fulford sketch-maps have grid marks
every 1/4 in one direction and every 1/8 in. in the other. As a result, I have drawn a line that
covers 8 grid lines or one inch. If you look at the scale information at
the bottom of the left panel, it will show the number of pixels the line covers. In this case, the line
covered 300 pixels. This fits with the fact that the sketch-map was
scanned at 300 dpi.
If you make a mistake in drawing your line, you can redraw it
by simply repeating the process. |
|
| I want the scale of the image to be 100
dpi, so I set the measured length to 100 and press the Apply button. The
program will then calculate new size values for 100 dpi. The image won't
be changed at this point, just the size parameters. |
|
| Finally, press the "Resize" button. This
will rescale the image so that one inch on paper corresponds to 100
pixels in the image. |
|
| D. Trimming. The next step in the process is
trimming the images. When people digitize cave data, they often scan the
whole survey book page which includes shot measurements and notes. To trace the image, all we
need is the sketch-map so we want to eliminate everything else. We do
this by clipping the image. |
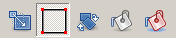
| Select the "Clip Tool" option from the
buttons at the top of the left hand panel. |
 |
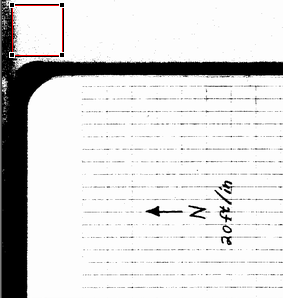
| When you do this, a square selection box
will appear on the image. It starts at the upper left hand corner of the
image so you may have to scroll the image to see it.
This box is moveable and sizeable. If you click in the middle of the
box and drag, you can move the whole box to another position. If you
click on the corners or the sides of the box and drag, you can resize the
box. As you drag to the border of the window, the program will
automatically scroll so you can reach the whole image.
As you position the box for clipping, look around the edges of the image
to make sure you are not clipping too much. |
 |
| If the clipping box is positioned
wrong, you can always reset the box to restore it to the upper left-hand
corner and start over. |
|
| I generally prefer to trim the image down
to the bare essentials. This makes it easier to merge the images later
on. Use your own judgment to decide how much to trim. At the very least,
you need to include everything you want to trace into the final map |
| When you are satisfied with your selection,
press the "Clip Button." The image will be trimmed to the boundaries of
the box. |
 |
| If you trimmed too much or want to change
the selection, press the "Undo" button to undo the changes you have
made. |
 |
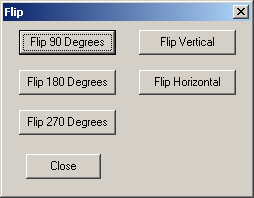
| E. Flipping. In the example image
for this tutorial, the sketch-map is scanned so the North Arrow i
points left instead of to the top of the page. To fix this, select the
"Tool -> Flip/Rotate" option from the menu bar. This will bring up the
"Flip" tool . The Flip Tool allows you to rotate the image 90, 180,
and 270 degrees. It also allows you to flip the image in the horizontal
and vertical directions. In the case of the example image, it needs to be
rotated 90 degrees. To do this, you just press the corresponding button.
Again, if you make a mistake, you can always to close the tool and press the
Undo button to restore the previous image. |
 |
| G. Rotation. The image should now be aligned
with North to the top, but there can still be small errors in the
rotation. Even errors of a few degrees can move the survey stations far
from the correct position requiring more drastic adjustments. For this reason, we will eliminate any
small rotation errors. |
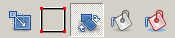
| To do this, select the "Rotation" button
from the buttons at the top of the left hand panel. |
 |
| Next enable the "Measure North" option
in bottom of the left-hand panel.
This will allow you to draw a north-arrow on the image to match the
north direction of the sketch-map. |

|
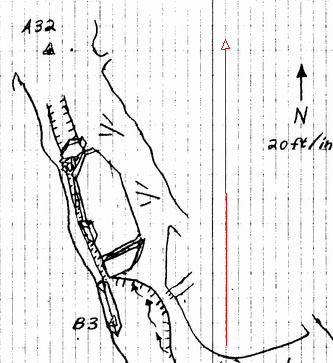
| Just click anywhere on the image and then
move the mouse cursor in the north-direction. This will draw a red line
on the image with an arrow at the north end. Keep moving the cursor
until it is positioned so the line is precisely oriented to north. This
will be very easy if you sketch-map has grid lines.
If you make a mistake and the line is positioned incorrectly, you can
start the line over again by re-clicking on the starting point and
dragging in north direction.
Generally speaking, you want to draw as long a line as possible. The
longer the line, the more accurate your measurement will be. If necessary, you can magnify the image using the Magnify slider bar
on the right side of the image. |
 |
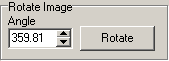
| When you are happy with the orientation of
the line, check the angle box. It will tell you how much your image is
rotated. If it is anything other than 0 or 360, you will want to press
the rotate button. This will rotate the image so it is precisely aligned
to north. |
 |
| G. Cleanup.
At this point you can
clean up the image if you want. You can also wait until all the images
have been assembled to do this. Generally, you want to remove extraneous
marks and lines so the passage outlines and floor detail are easy to
see. This is accomplished using the Pen, and Bucket Fill tools on the
top of the left panel. There are three main drawing tools: |
 |
| 1. Pen Tool. When you select the Pen
tool, you can draw on the image. The pen size is adjustable so you can
fill large areas with color. |
 |
| 2. Bucket Fill.
The Bucket Fill
option does a flood-fill starting at the point where you click. This
means that it fills any adjacent pixels that match the color of the
pixel you clicked on. The fill stops when the program encounters a
non-matching pixel, so it spreads or floods all the nearby, matching
colors. |
 |
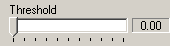
| You can control the sensitivity of the
fill, with the Threshold option. A low threshold value means the pixels
are filled only if they are an exact match for the pixel you clicked on.
Higher values mean the program is less picky about the match. |
 |
| 3. Color Fill. The Color Fill option
is similar to the Flood Fill, except that it works on all pixels in the
image, not just adjacent pixels. In other words, the program searches
through the whole image looking for matching colors. This option also
has a Threshold options that controls the color match sensitivity. |
 |
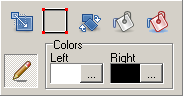
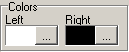
| 4. Color Options. Each of
tools produces a different color depending on whether you click with the
right or left mouse button. You can set the colors to anything you like
by press the button just the right of the color. |
|
| H. Save Image.
When you are
satisfied with the appearance of the sketch-map, press the OK button at
the bottom of the window |
 |
| This will take you back to main windows.
Press the Save Button and save the image with a unique filename. |
|
|
|
|
|
|
| Sponsored Links |
|
|
| Sponsored Links |
|
|
| Sponsored
Links |
|
|
| Sponsored Links |
|
|
|